Raw reads: The Starting Point
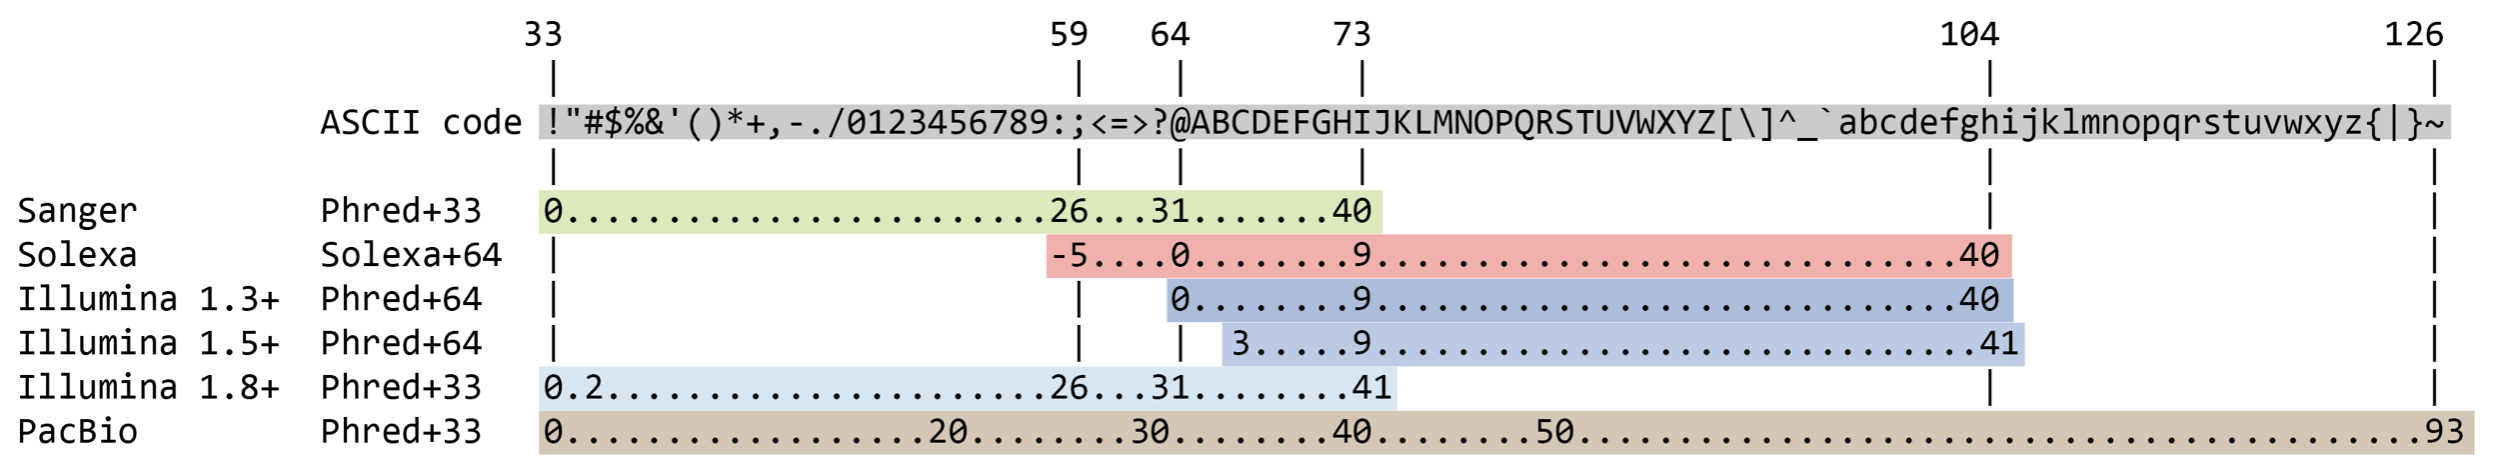
FASTQ format
What does “quality score” mean?
The quality score is used to identify the probability of the correct identification of the corresponding nucleotide.
Raw reads: The Starting Point
FASTQ format
What does “quality score” mean?
The quality score is used to identify the probability of the correct identification of the corresponding nucleotide.

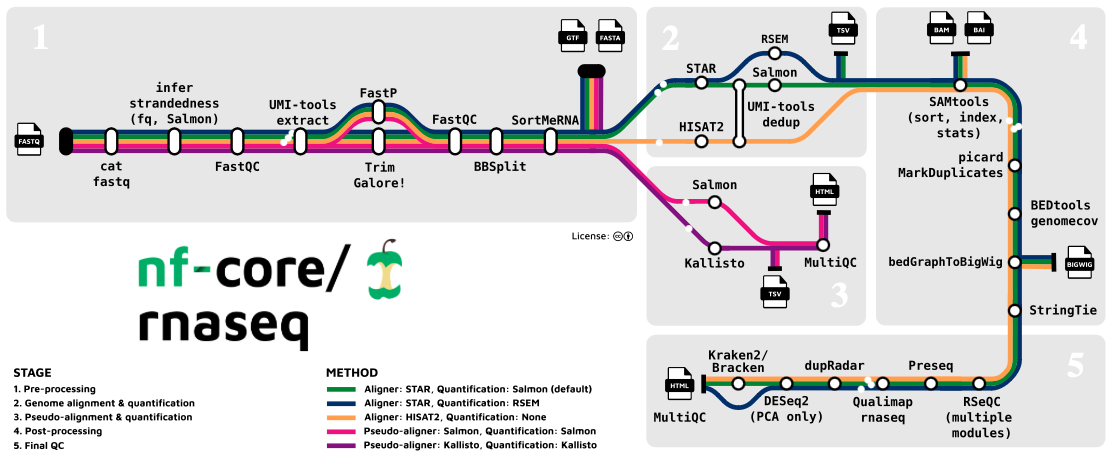
Pre-processing Tools
UMI-tools extract
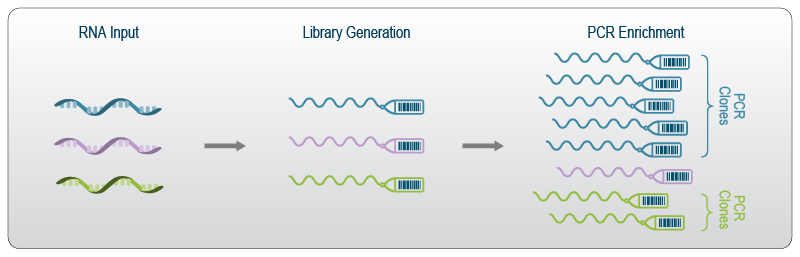
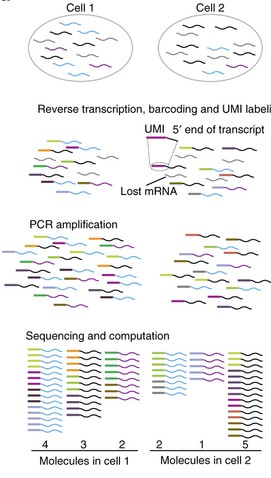
- What are UMIs?
- Unique Molecular Identifiers (UMIs) are short random sequences attached to each cDNA molecule during library preparation.
- They act as “molecular barcodes” to identify unique molecules.
- Why are UMIs important?
- UMIs help to distinguish PCR duplicates from true biological duplicates.
- This improves the accuracy of gene expression quantification, especially for low-abundance transcripts.
- What does
UMI-tools extractdo?- Identifies and extracts UMIs from sequencing reads.
- Moves UMIs to the read name for downstream analysis.
- Requires information about the UMI location in the read.
- Benefits:
- Improved accuracy in gene expression quantification.
- Reduced bias due to PCR amplification.
UMI-tools
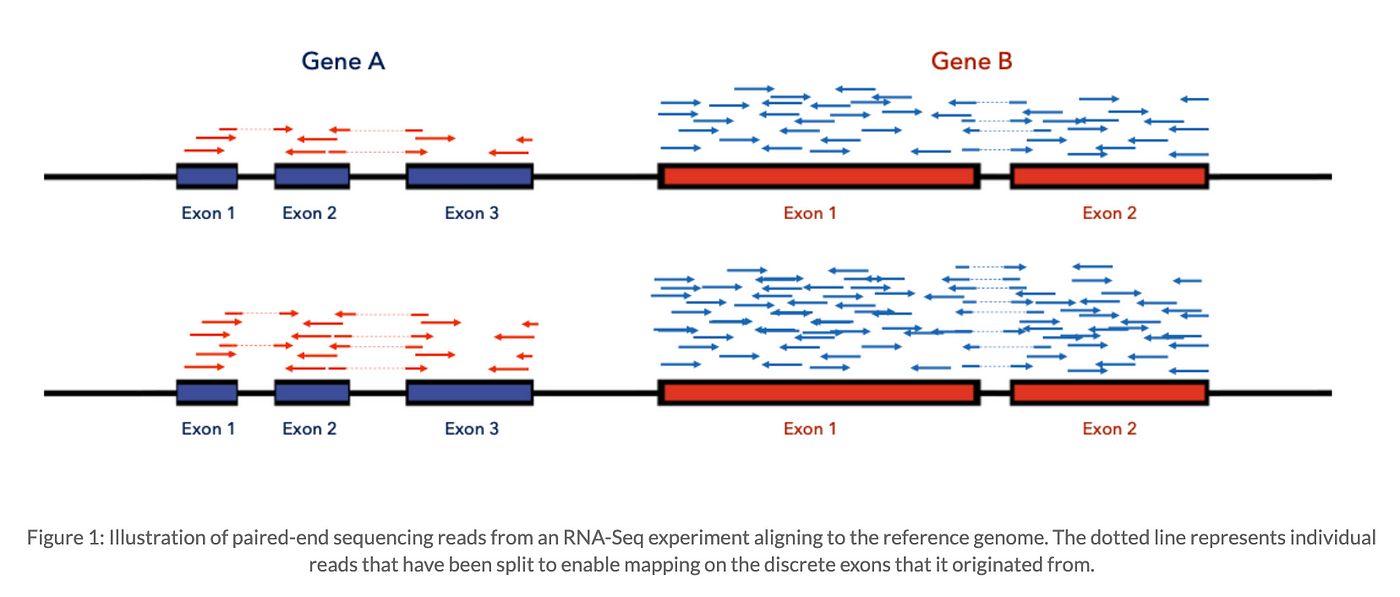
Alignment and Quantification
Read Alignment
- Purpose:
- To map sequencing reads to a reference genome or transcriptome.
- Why is it important?
- Identify the genomic origin of each read.
- Determine which genes or transcripts are expressed.
- Discover genetic variations (SNPs, indels).
- Challenges:
- Reads may contain sequencing errors.
- Reads may map to multiple locations (multi-mapping reads).
- Genomes contain repetitive regions.
- Output: A BAM (Binary Alignment/Map) file containing alignment information.
Alignment and Quantification
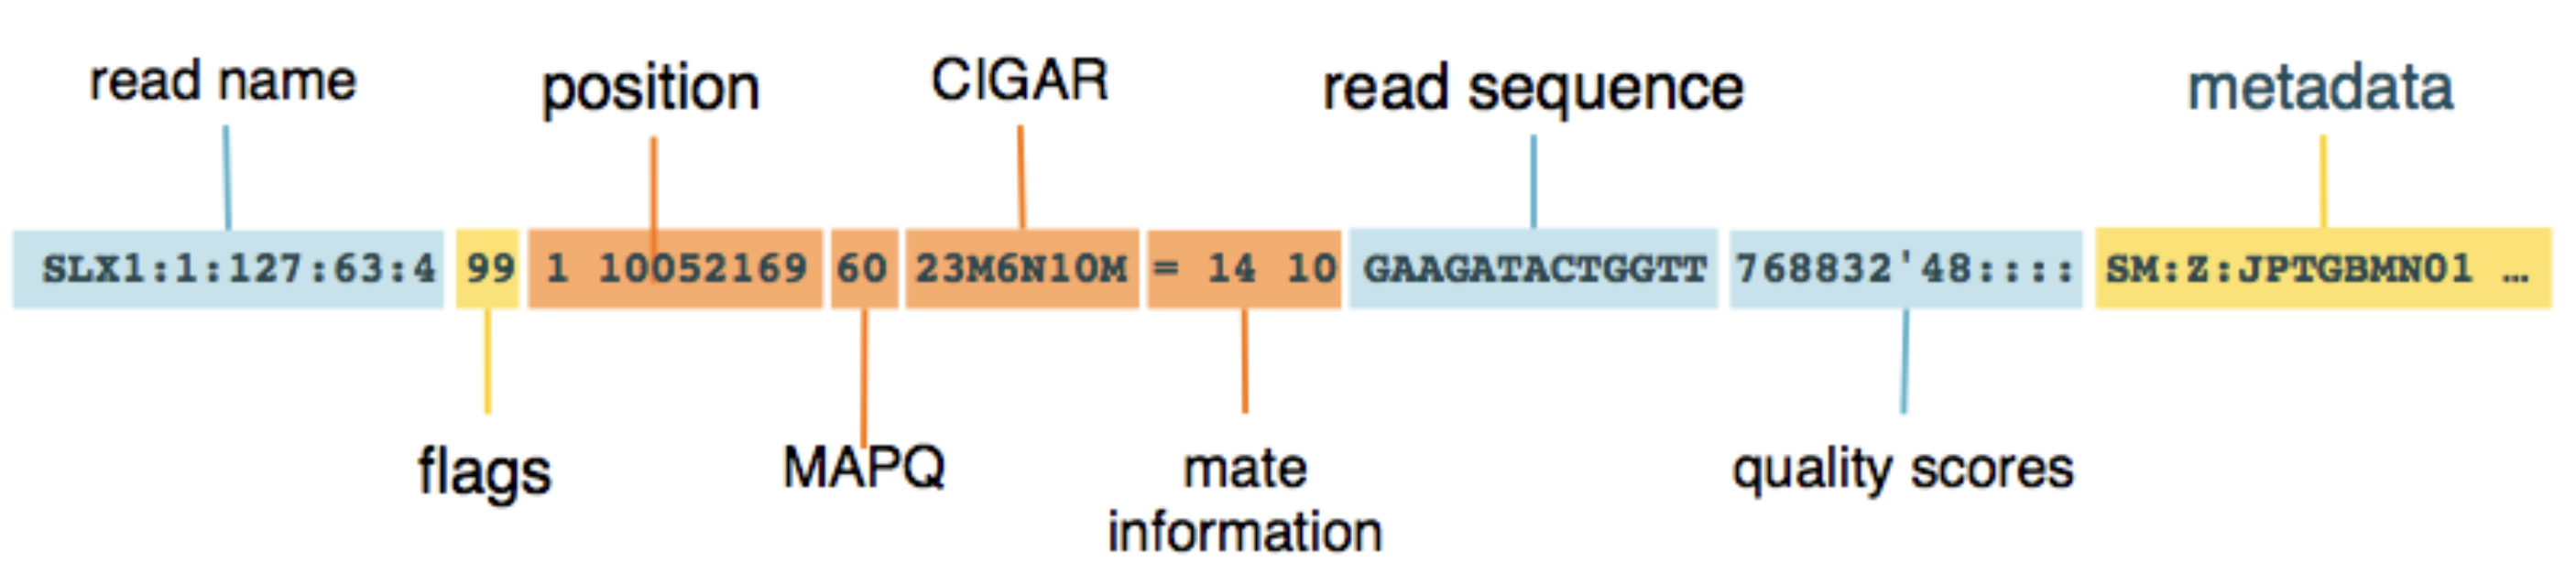
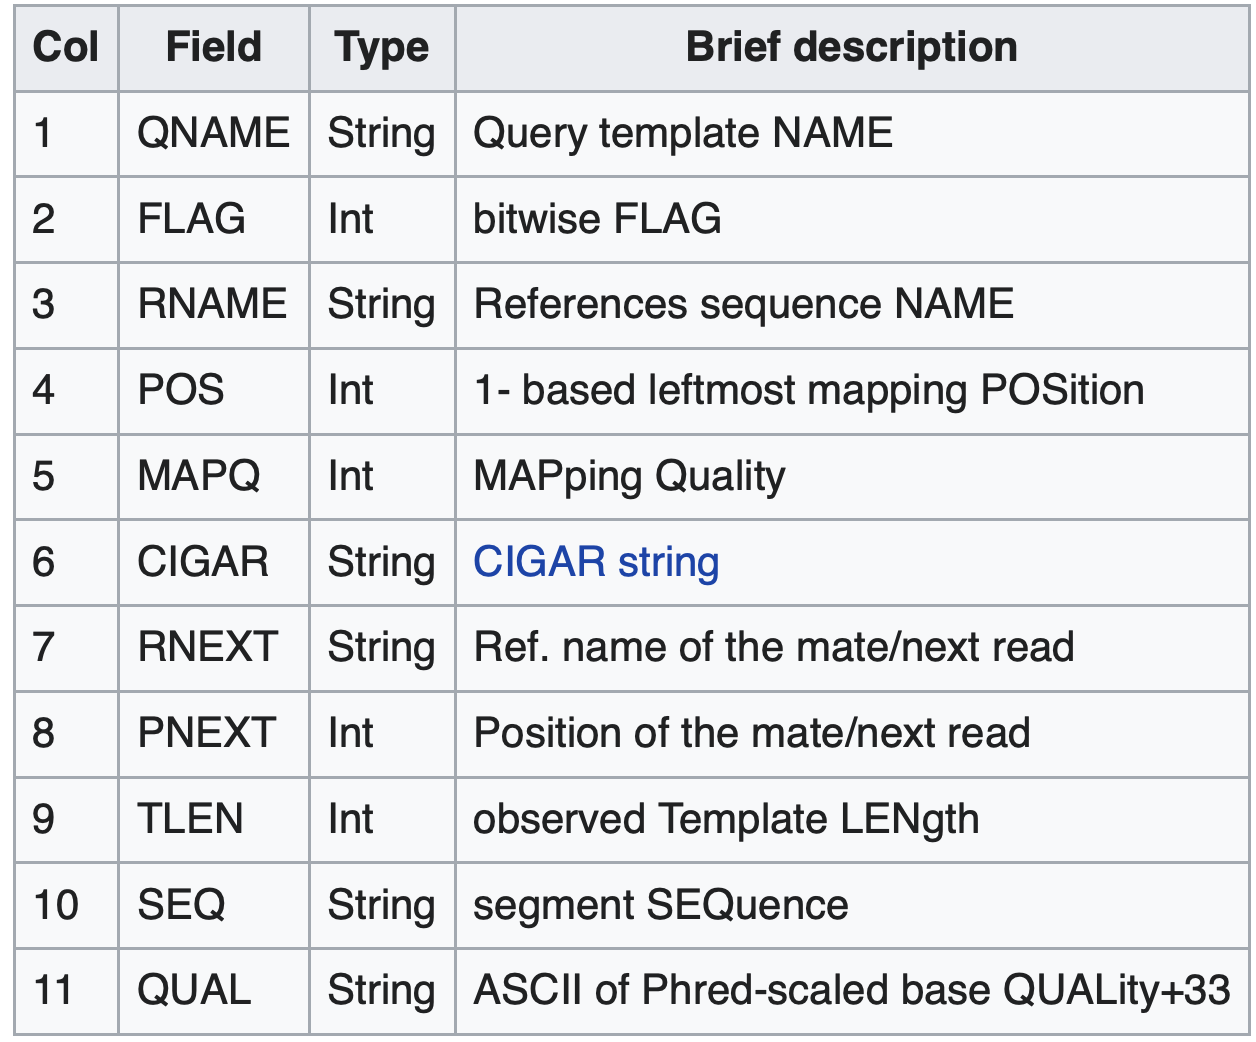
SAM/BAM Format: Storing Alignment Information
- Alignment section: Each line represents a single read and its alignment to the reference.
- Includes information about mapping position, quality scores, alignment flags, and more.
Alignment and Quantification
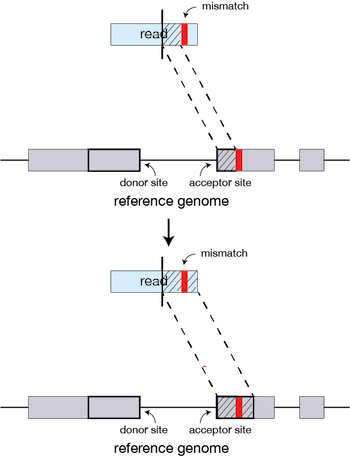
STAR Aligner
- What it is:
- A widely used splice-aware aligner for RNA-Seq data.
- Key features:
- Fast and efficient alignment.
- Accurate handling of spliced reads.
- Can detect novel splice junctions.
- Supports various RNA-Seq protocols.
- Advantages:
- High accuracy
- Speed
- Versatility
Alignment and Quantification
HISAT2
- What it is:
- Another popular splice-aware aligner for RNA-Seq.
- Key features:
- Based on the Burrows-Wheeler transform.
- Fast and memory-efficient.
- Supports both DNA and RNA alignment.
- Comparison to STAR:
- May be slightly faster for some datasets.
- May have slightly lower accuracy for certain types of reads.
- Choice often depends on specific needs and preferences.
Alignment and Quantification
UMI-tools dedup
- What it does:
- Identifies and removes PCR duplicates from RNA-Seq data using Unique Molecular Identifiers (UMIs).
- Groups reads with the same UMI and genomic mapping location.
- Selects the read with the highest quality score as the representative read for each group.
- Why is it important?
- PCR amplification during library preparation can introduce duplicate reads.
- These duplicates can bias gene expression estimates, especially for low-abundance transcripts.
UMI-tools deduphelps to correct for this bias and improve accuracy.
- Benefits:
- More accurate gene expression quantification.
- Reduced false positives in differential expression analysis.
- Improved sensitivity for detecting rare transcripts.
Alignment and Quantification
RSEM
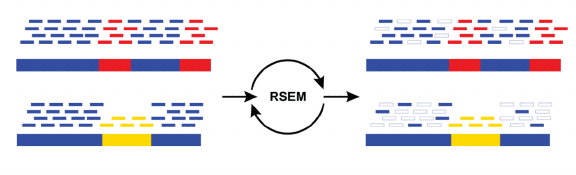
- What it is:
- RSEM is a software package for estimating gene and isoform expression levels from RNA-Seq data.
- Key features:
- Uses a statistical model to estimate transcript abundance from aligned reads.
- Can handle different types of RNA-Seq data (single-end, paired-end).
- Provides various output formats (counts, TPM, FPKM).
Pseudo-aligners
Kallisto vs Salmon
| Feature | Kallisto  |
Salmon 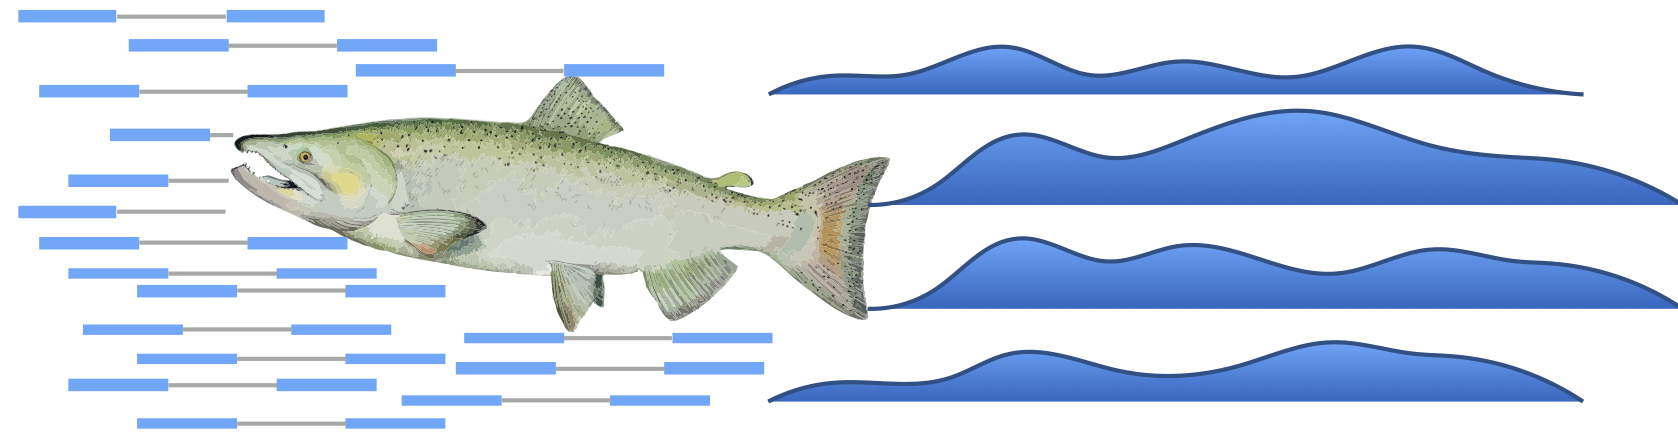 |
|---|---|---|
| Algorithm | Pseudoalignment (k-mers) | Quasi-mapping (BWT) |
| Speed | Fast | Faster |
| Memory Usage | Lower | Higher |
| Features | Basic | More advanced (library types, bootstrapping) |
| Accuracy | High | High |
| Ease of Use | High | High |
| Output Formats | Abundance estimates | Abundance estimates, counts, TPM, etc. |
| Applications | Gene expression, DE analysis | Gene expression, DE analysis, isoform quantification |
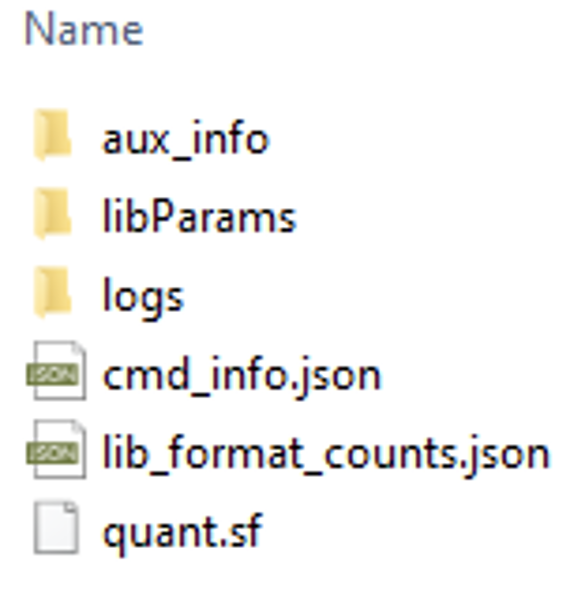
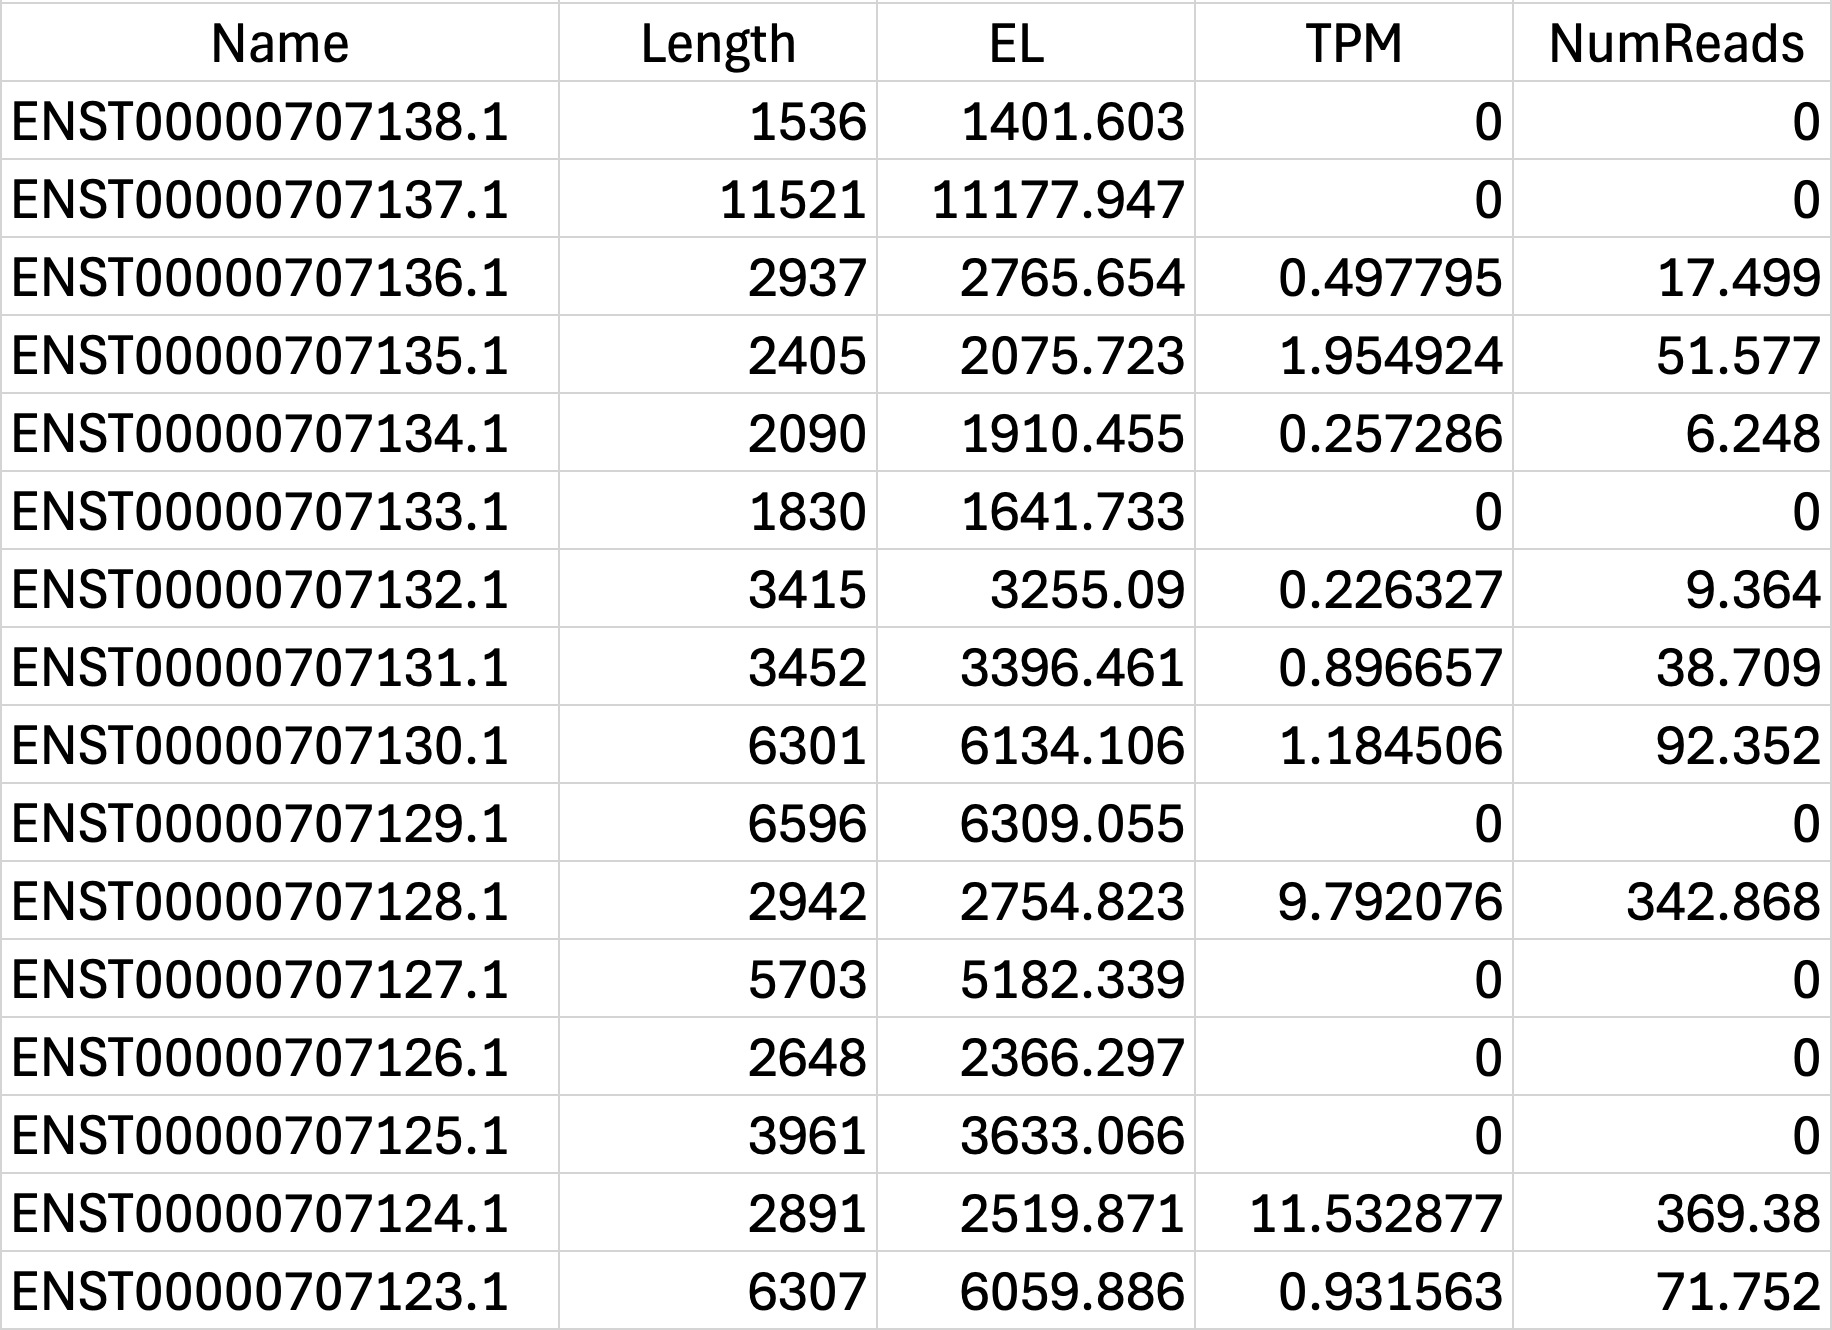
Pseudo-aligners
Salmon Output File Formats
Downstream Analysis
Kraken2: Identifying Microbial Communities in Your Samples
- What it is:
- A fast and accurate tool for assigning taxonomic labels to sequencing reads.
- Why is it useful for RNA-Seq?
- RNA-Seq data can sometimes contain reads from microbial organisms (e.g., in microbiome studies, host-associated samples).
- Kraken2 can identify and classify these microbial reads, providing insights into the microbial community present in the sample.
- How it works:
- Assigns taxonomic classifications to reads based on the best match.
- Benefits:
- Fast and efficient classification.
- Accurate identification of microbial species.
- Can be used with both DNA and RNA sequencing data.