Sample Preparation
RNA Extraction
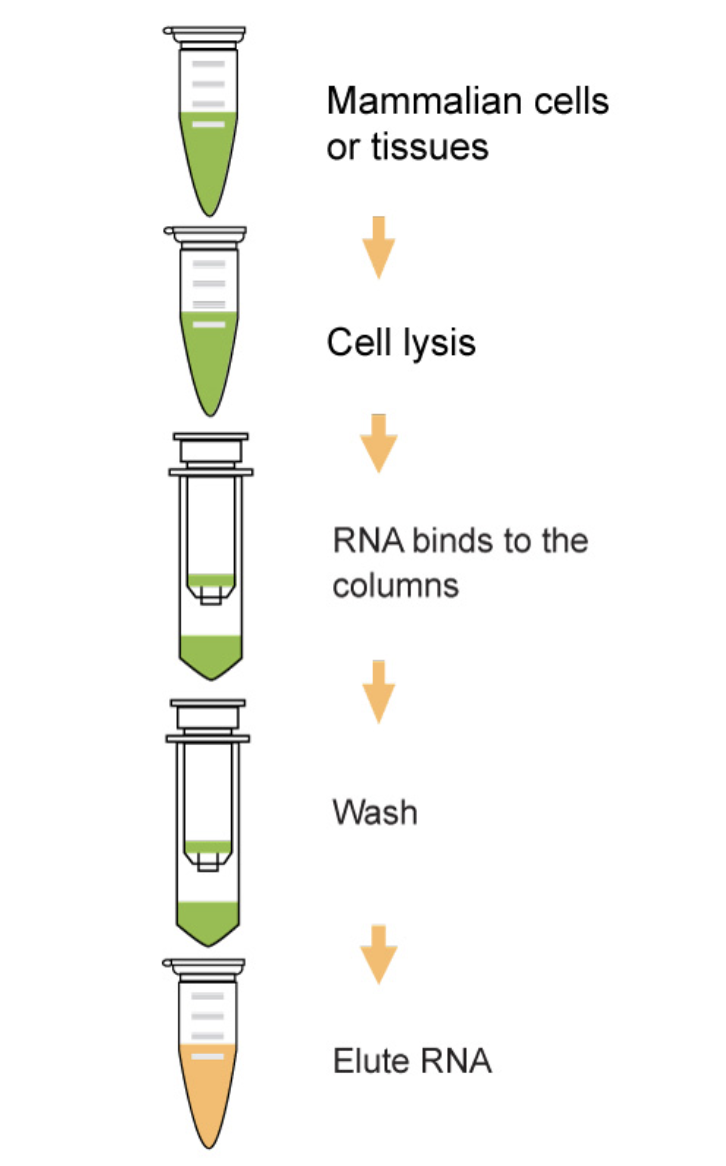
- Goals:
- Lyse cells/tissues
- Remove contaminants (DNA, proteins, lipids)
- Preserve RNA integrity
- Methods:
- Phenol-chloroform extraction
- Column-based kits (silica membrane)
Importance of High-Quality RNA
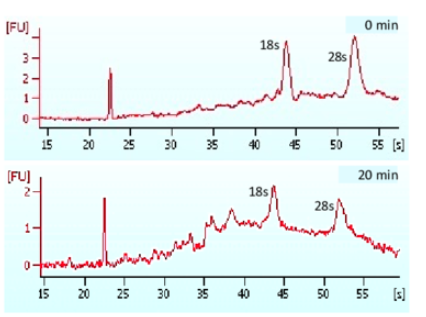
- High-quality RNA is the cornerstone of successful RNA-Seq.
- Degraded or contaminated RNA can lead to:
- Inaccurate gene expression measurements
- Misleading conclusions
- Wasted time and resources
- Prevent RNA degradation:
- Use RNase-free reagents and equipment.
- Store RNA at -80°C.
- Minimize freeze-thaw cycles.
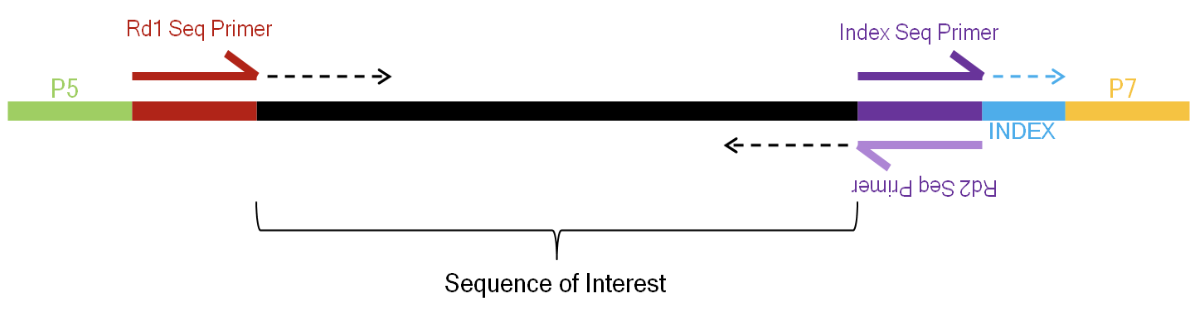
Attachment of adapters
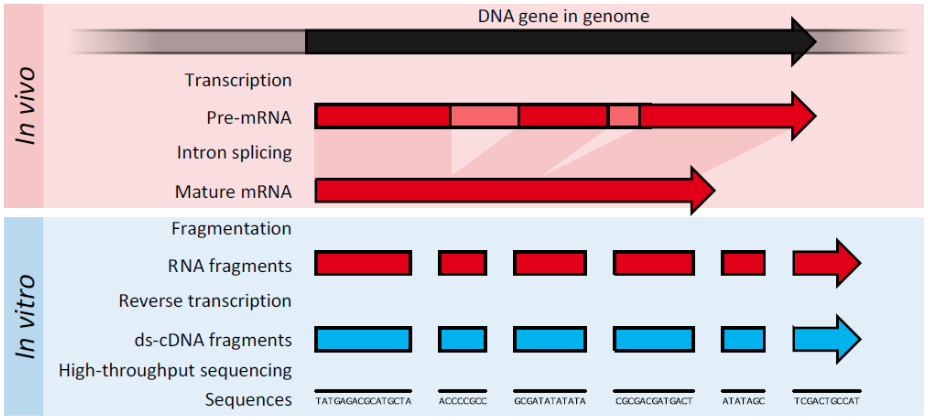
Adapters are a short, chemically-synthesised oligonucleotide that can be attached to the ends of DNA molecules (cDNA Synthesis: RNA to DNA)
Act as barcodes to identify where each nucleotide was originally located
Library quantification
- Why quantify?
- Optimal sequencing results
- Determine loading concentration
- Ensure even coverage
- Methods:
- Fluorometric methods (e.g., Qubit)
- qPCR
- Capillary electrophoresis (e.g., Bioanalyzer)
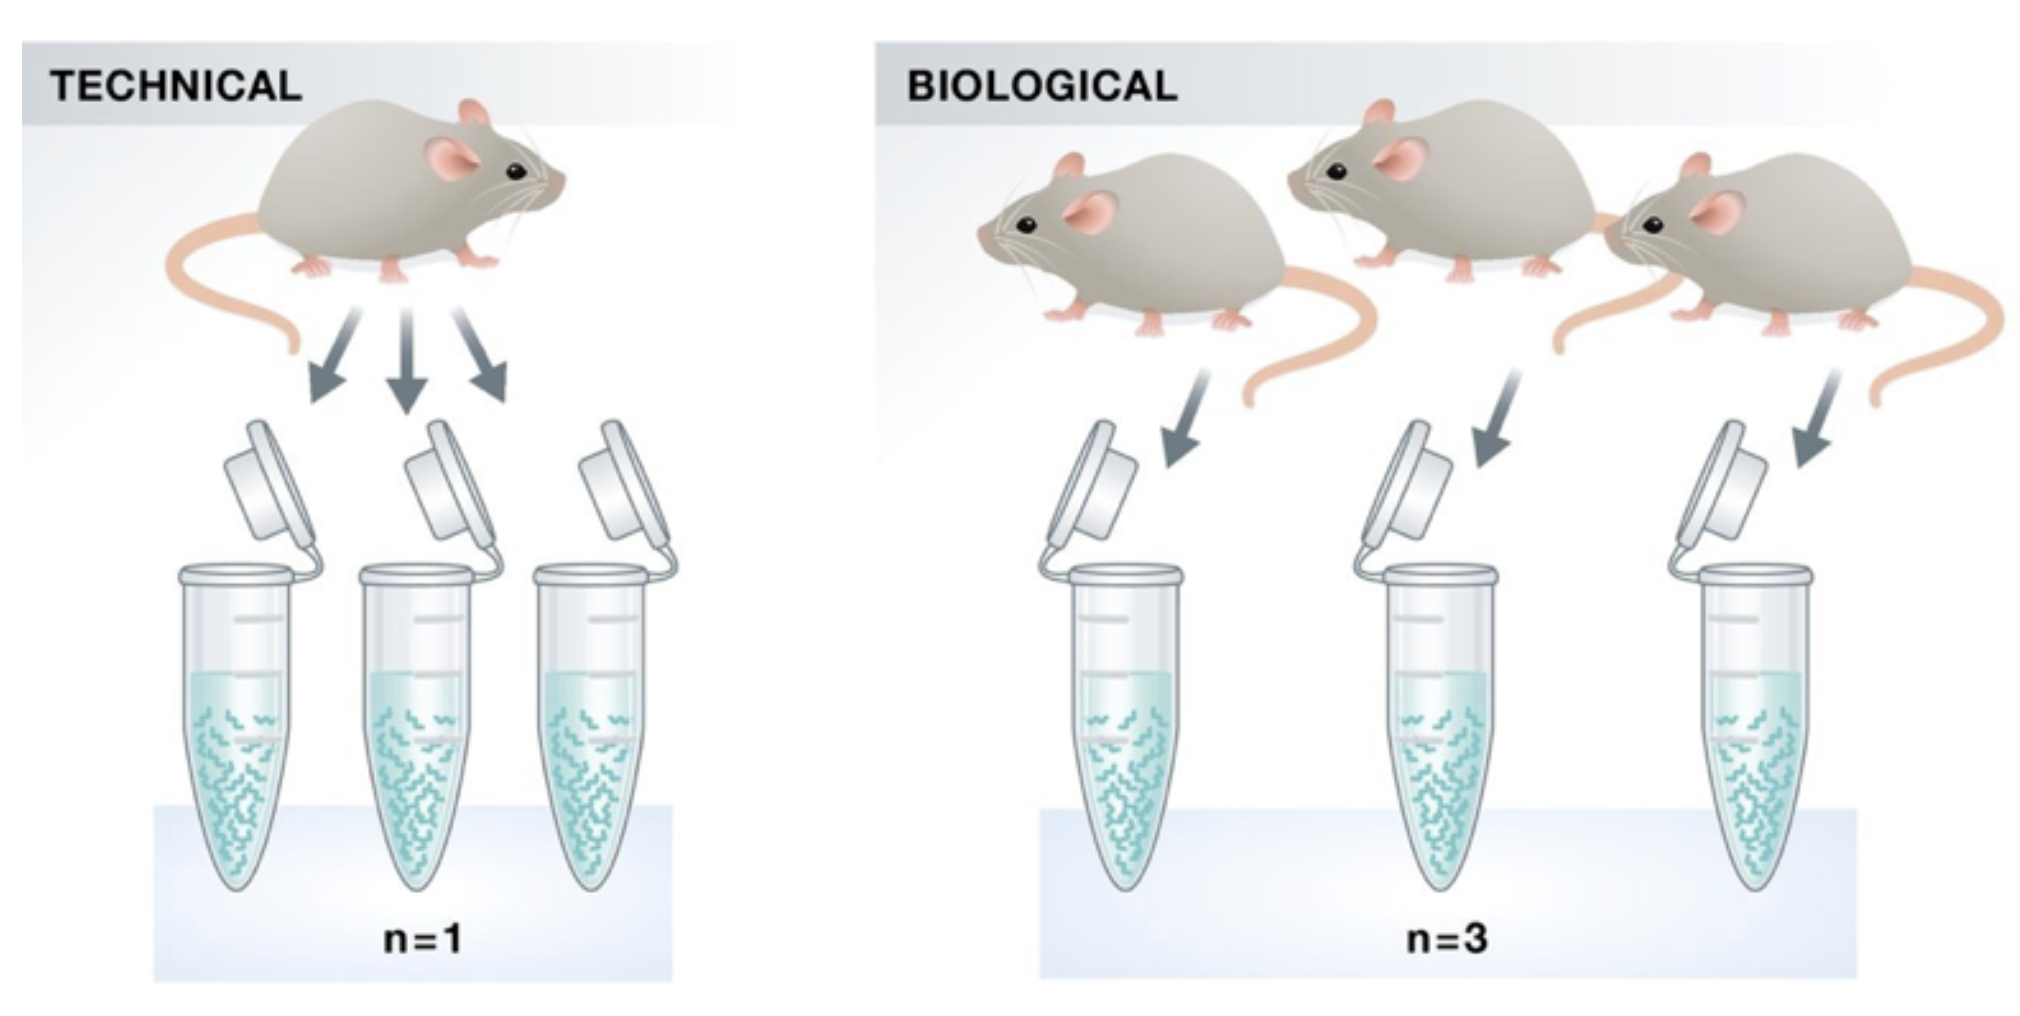
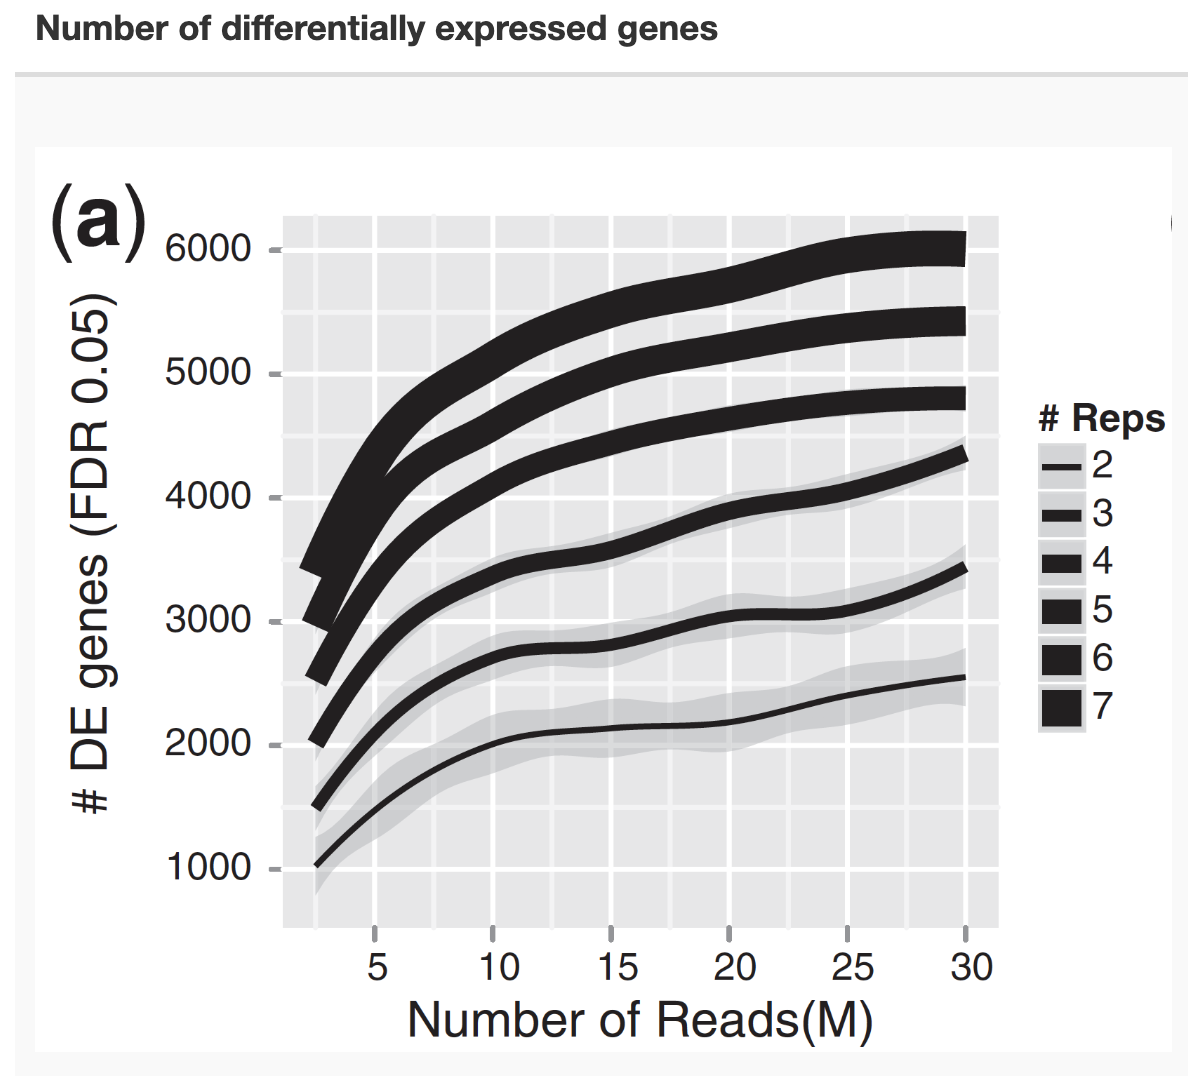
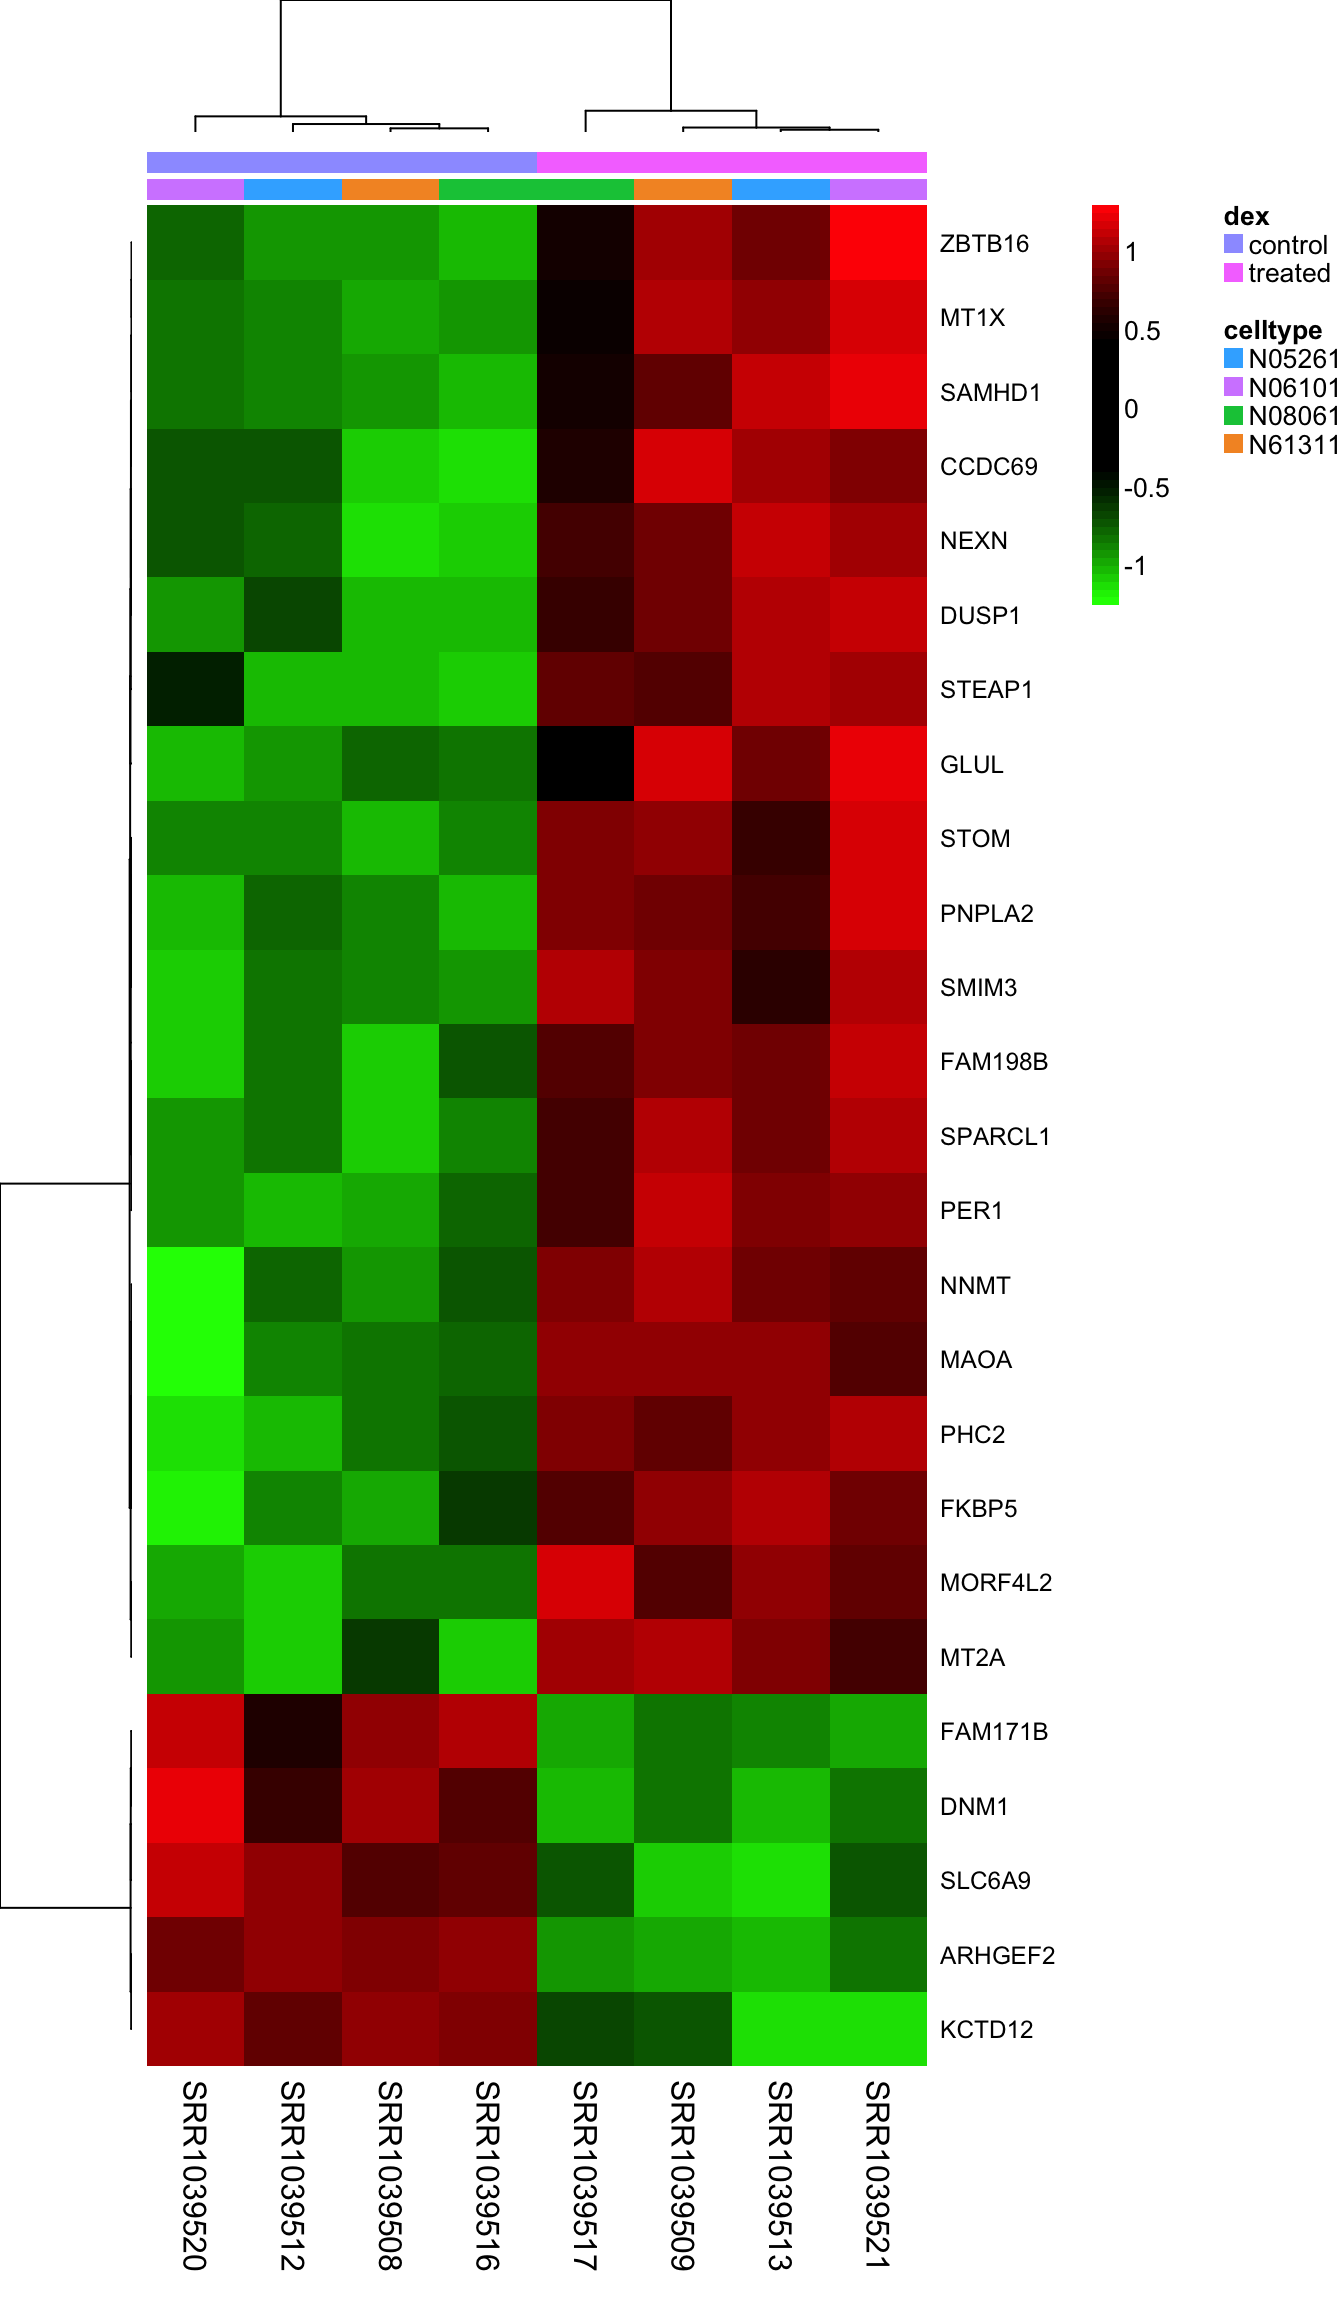
Klaus B., EMBO J (2015) 34: 2727-2730
Biological replicates are of greater importance than sequencing depth
The central dogma
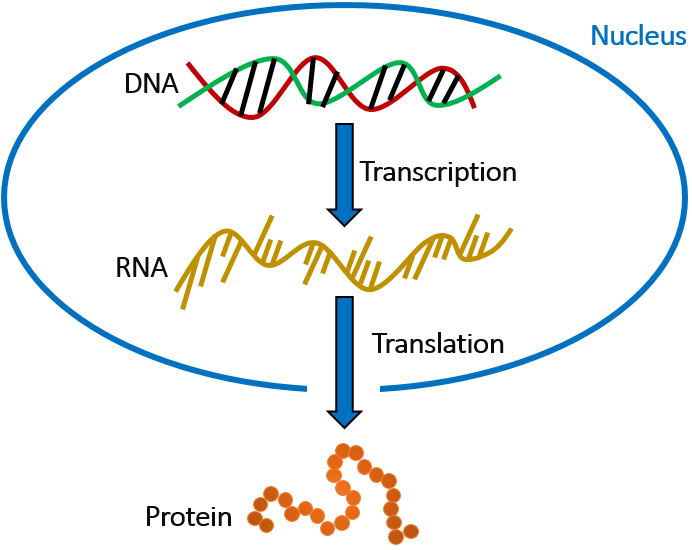
- DNA: The blueprint of genetic information
- RNA: The messenger carrying genetic instructions
- Protein: The functional molecules in cells
Why Study RNA?
- Dynamic reflection of cellular activity: Unlike DNA, which is relatively static, RNA levels change rapidly in response to internal and external stimuli.
- Provides a snapshot of what genes are actively being expressed at a specific time.
- Understanding gene regulation: Studying RNA helps us understand how genes are turned on or off, and to what extent, in different conditions.
Why Study RNA?
- Insights into cellular processes: RNA plays diverse roles in many cellular processes, including:
- Protein synthesis (mRNA)
- Gene regulation (microRNAs, long non-coding RNAs)
- Catalysis (ribozymes)
- Disease biomarkers and drug targets: Changes in RNA expression can be indicative of disease states, making RNA a valuable source of biomarkers for diagnosis and prognosis.
Sanger Sequencing
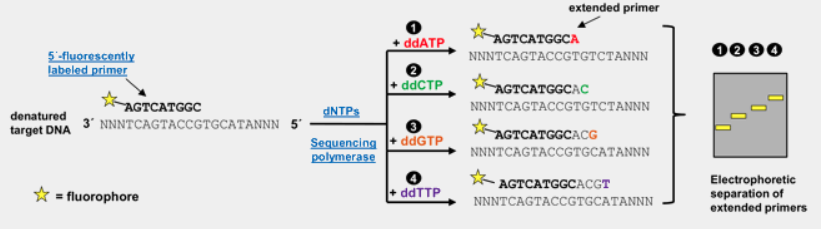
Sanger Sequencing
Sequence by Ligation
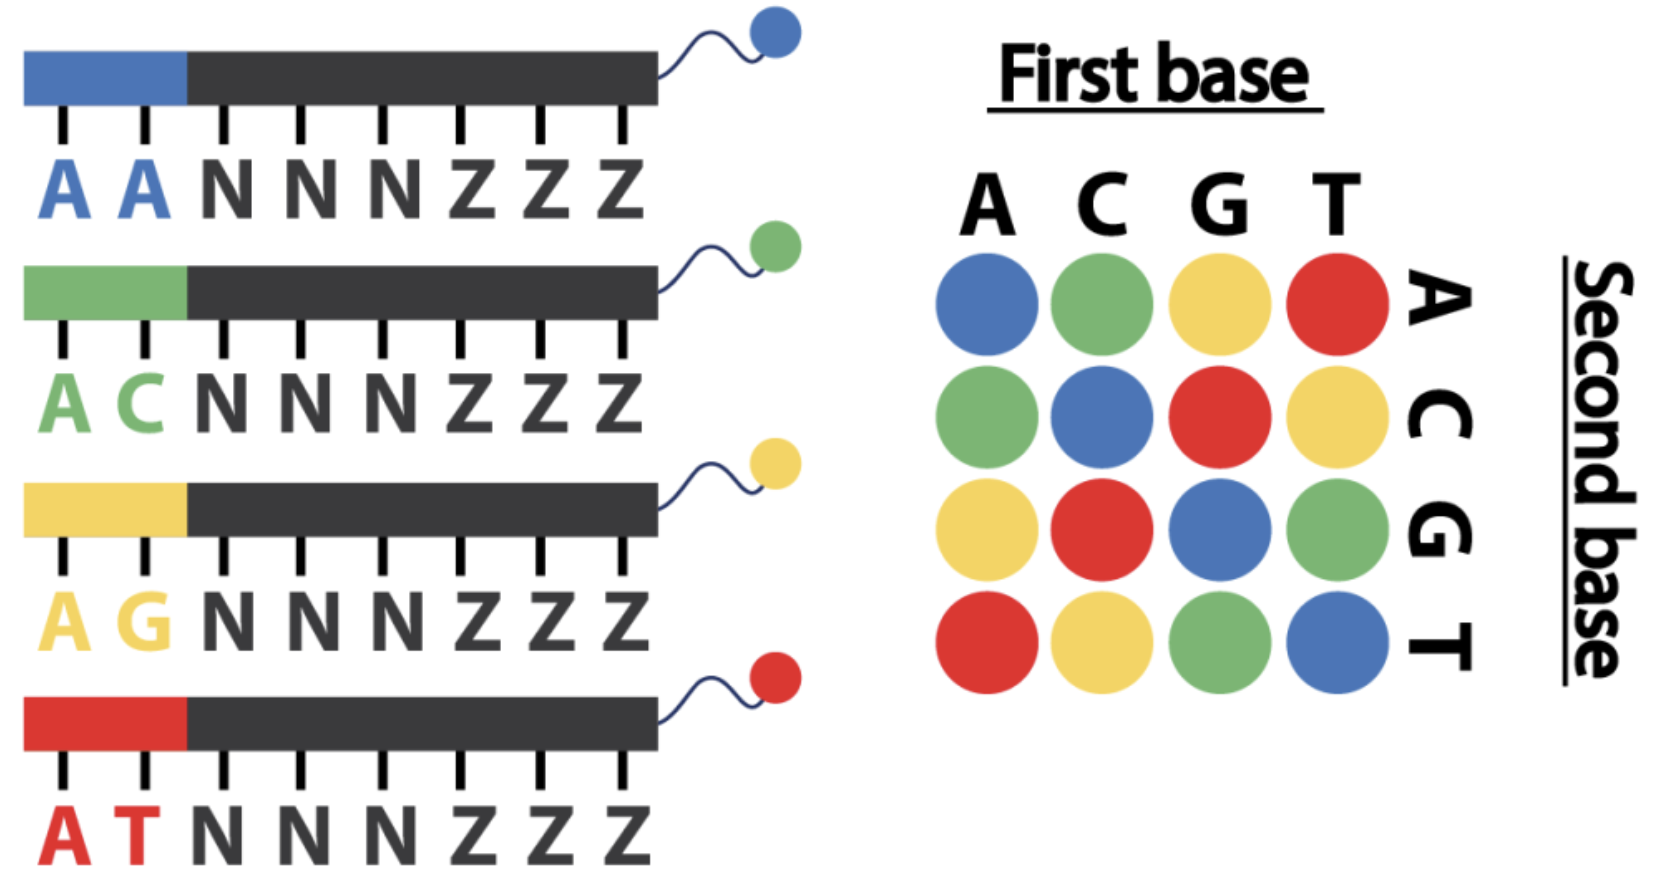
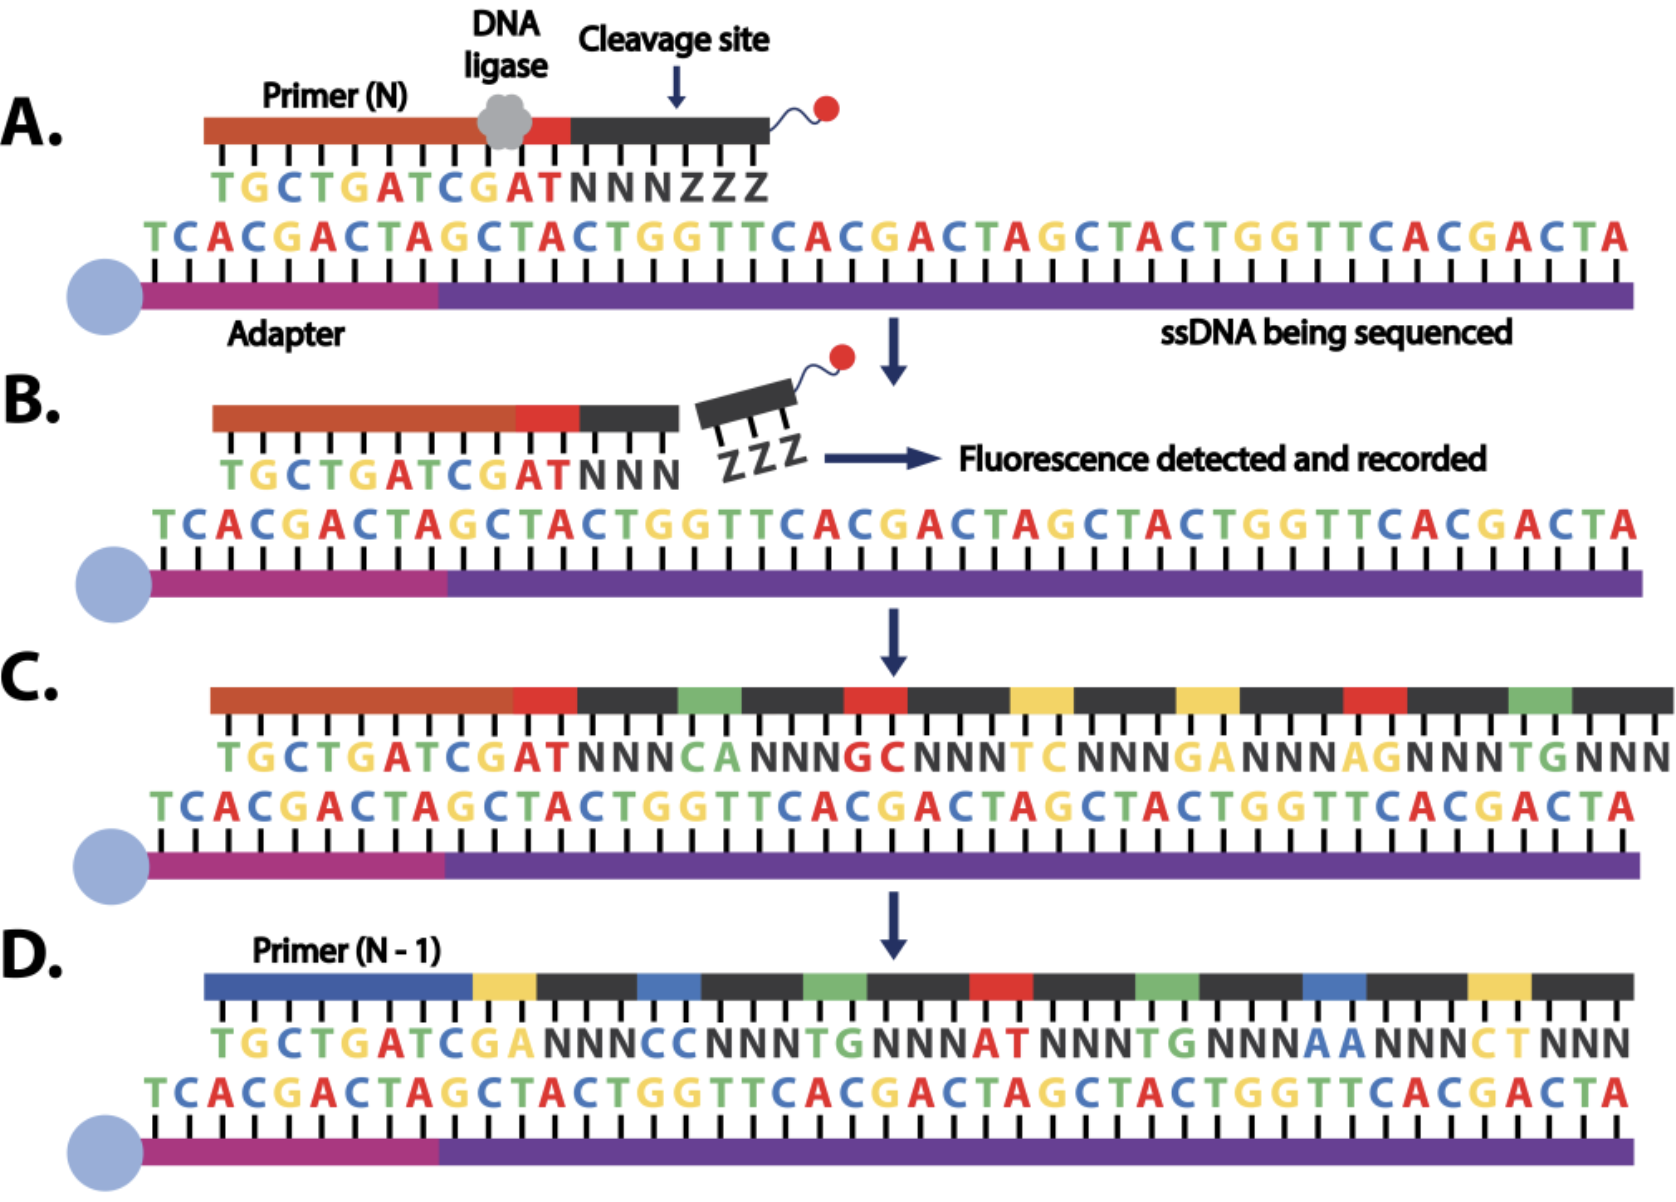
Considered to be one of the most accurate second-generation sequencing technologies
it can take up to seven days to complete a single run and its short read length of 35 bp
Thermo Fisher Scientific shut down all SOLiD sequencing platforms in 2016
Pyrosequencing
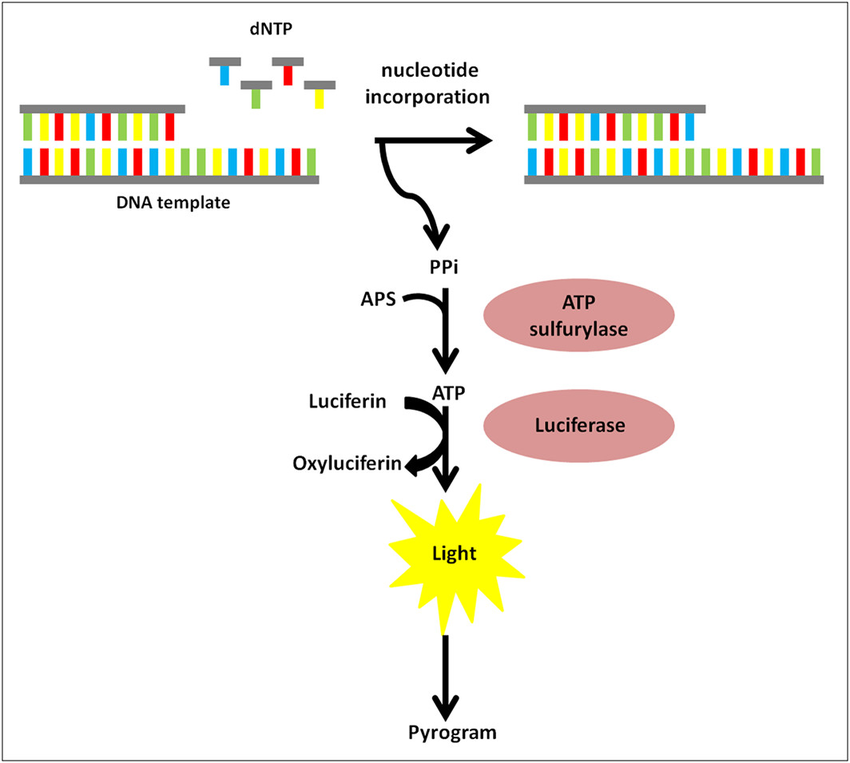
Large read lenght generation
High reagent cost
High error rate for homopolymers
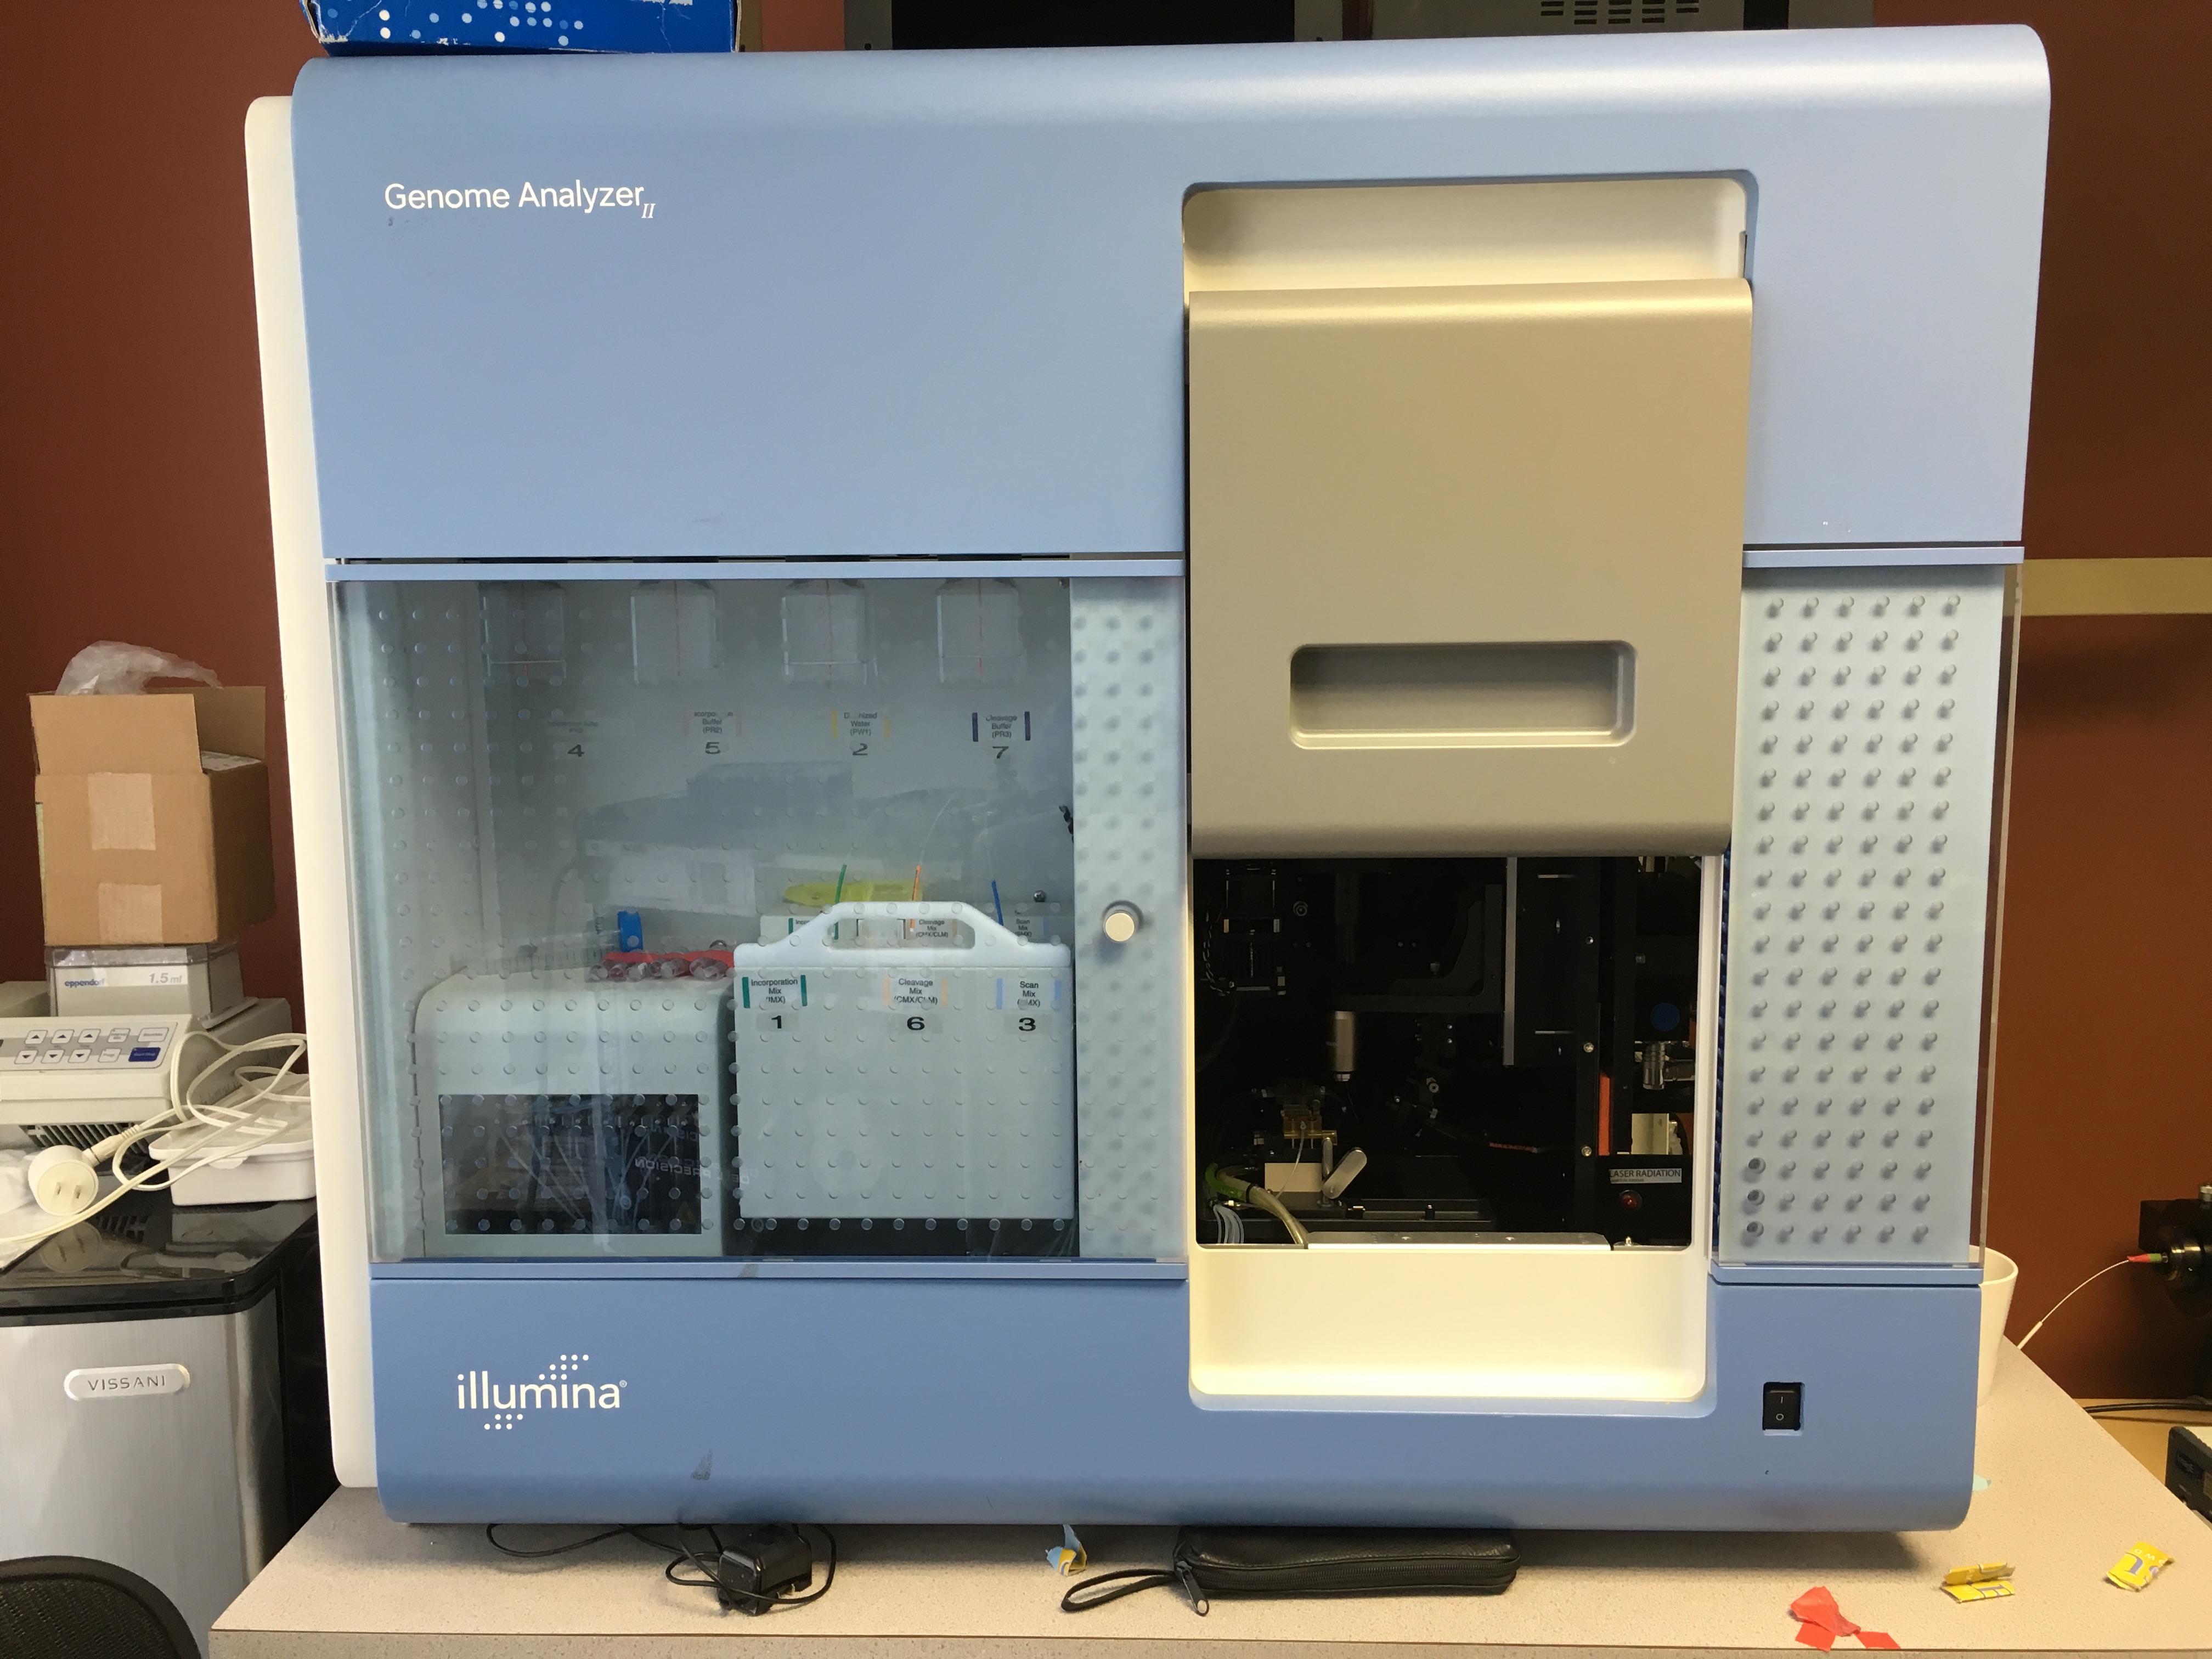
Sequence by synthesis - History
1997: Evolution of a Novel Approach to Sequencing
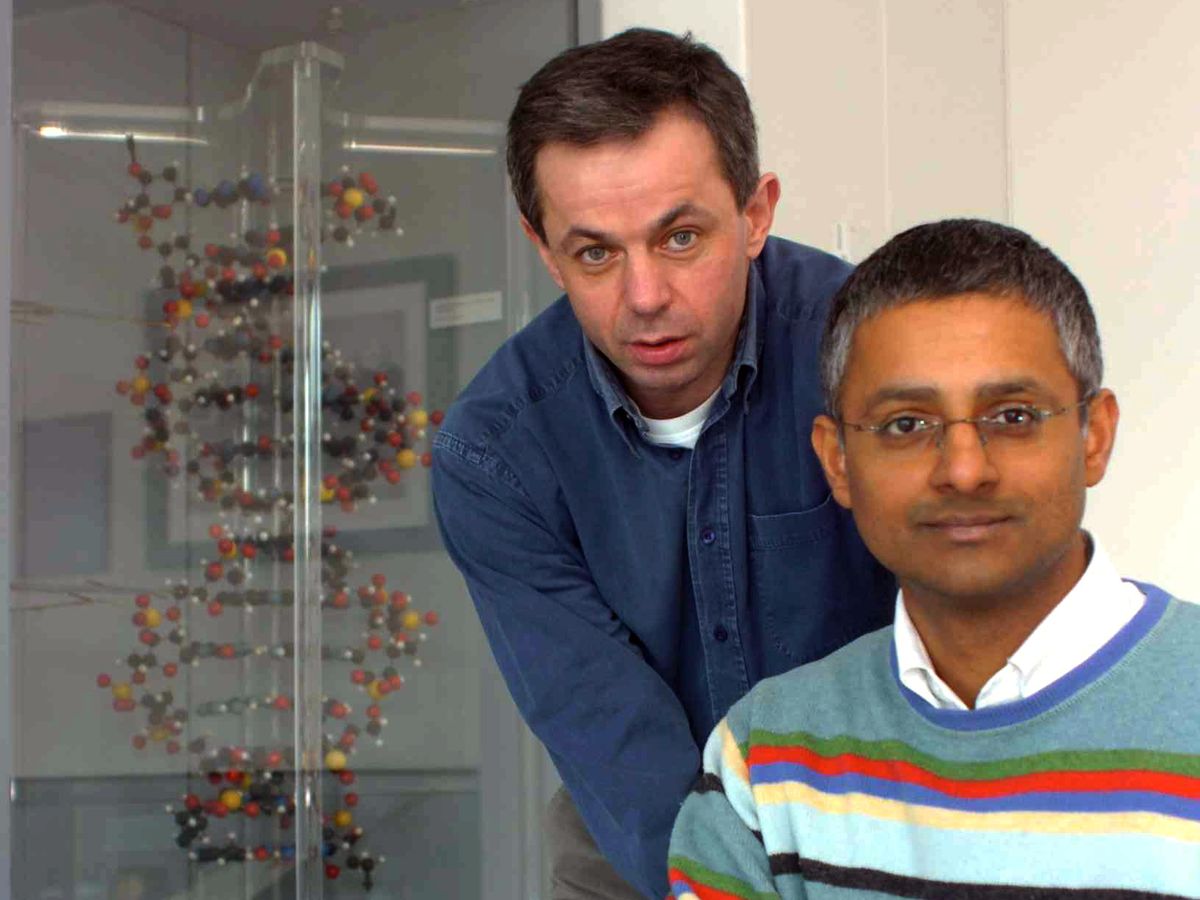
Shankar Balasubramanian and David Klenerman
Sequence by synthesis - History
1998: Formation of Solexa

Sequence by synthesis - History
2004: Molecular Clustering Technology Integration
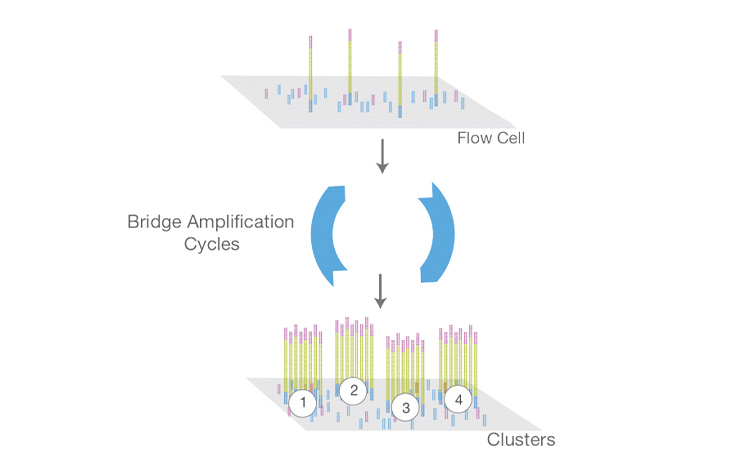
Cluster generation (also known as “bridge amplification”)
Sequence by synthesis - History
2005: phiX-174 Genome Sequencing
2005: Integration of Lynx Therapeutics
2007: Illumina Acquires Solexa
Single-Ended vs. Paired-End
Choosing Your Sequencing Strategy
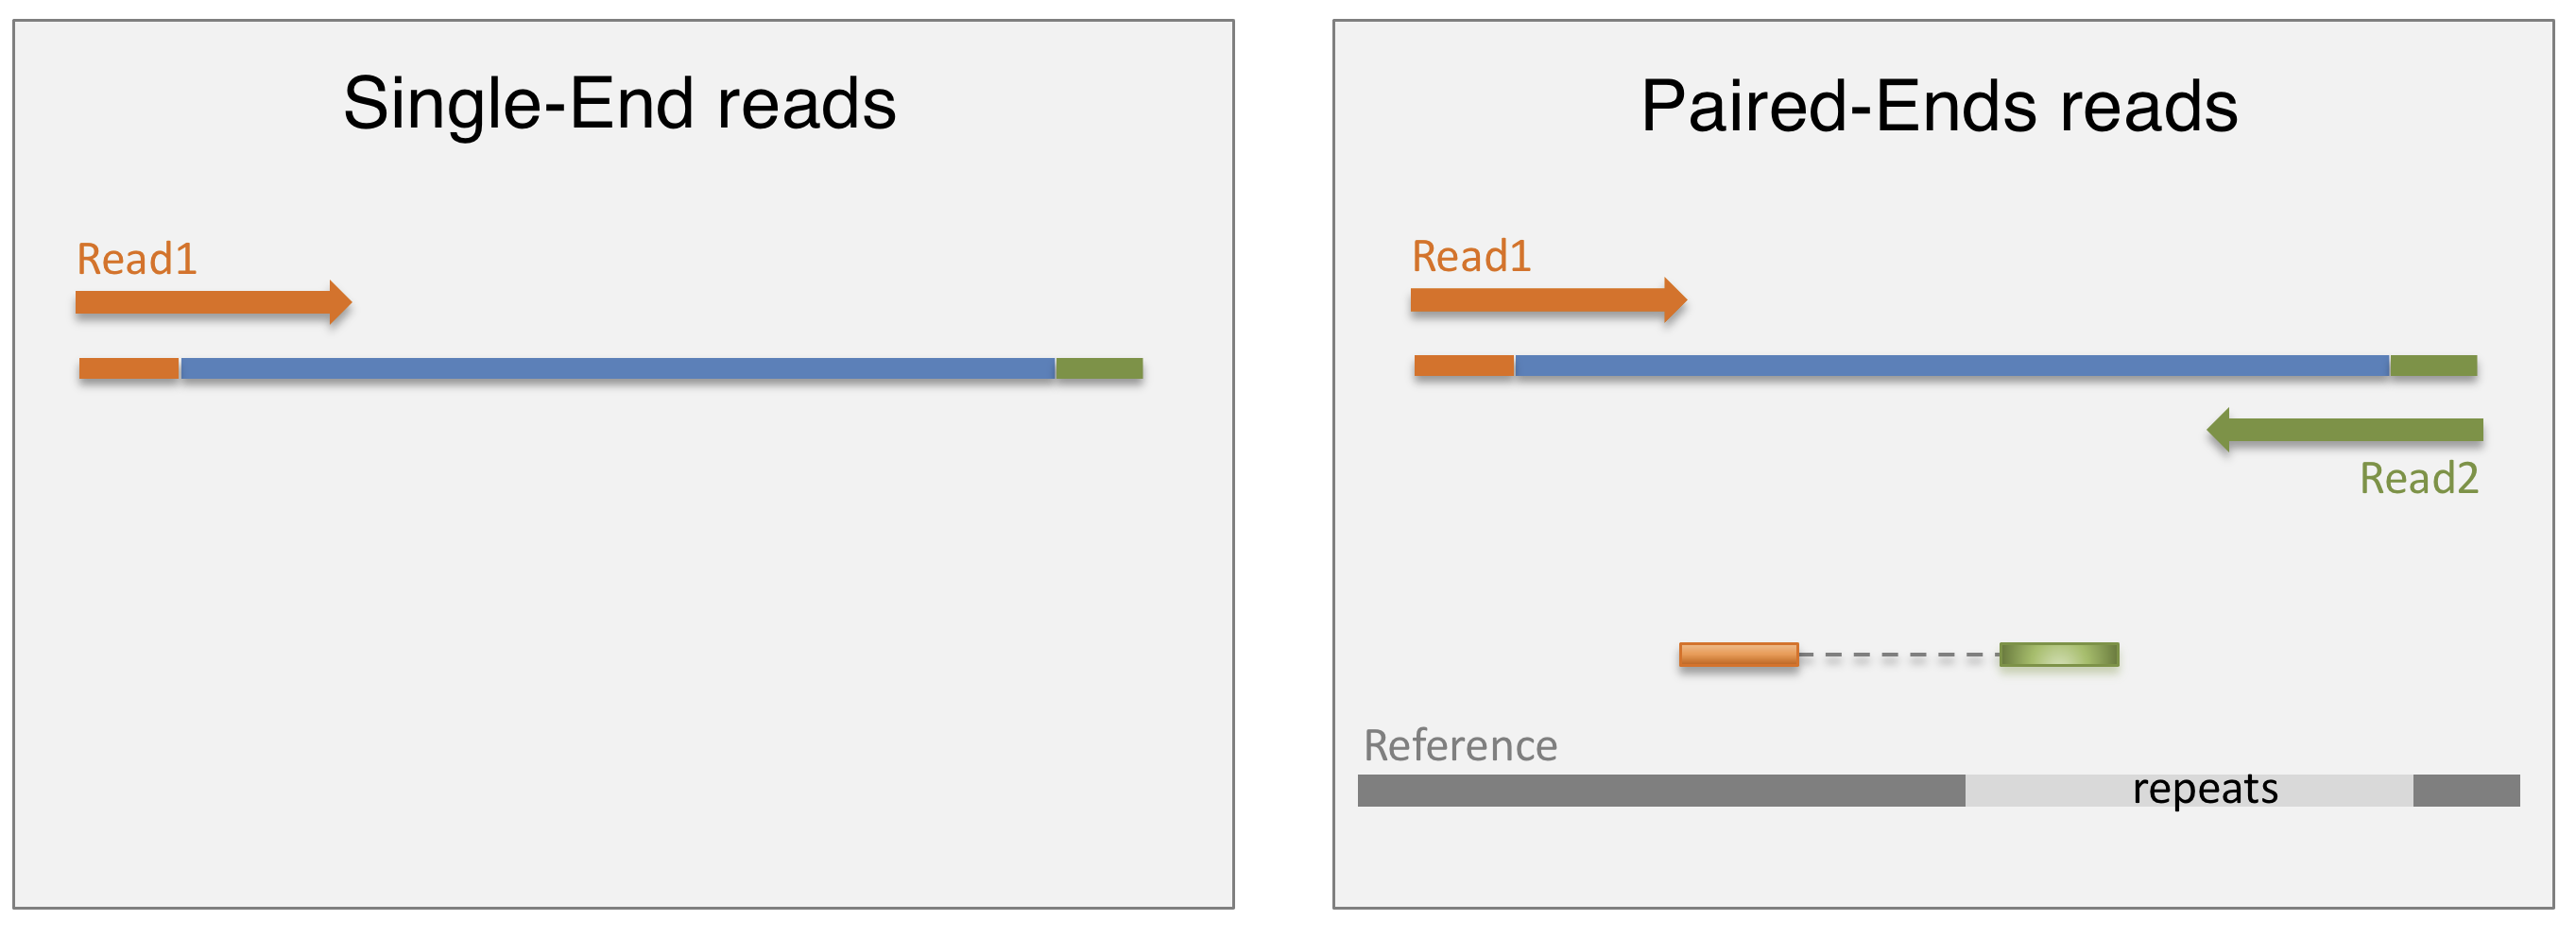
- Single-end sequencing:
- One read per fragment
- Simpler, cost-effective
- Suitable for gene expression profiling
- Paired-end sequencing:
- Two reads per fragment
- More information, improved accuracy
- Useful for genome assembly, variant detection, isoform identification
- Choice depends on:
- Research question
- Budget
- Desired accuracy
Sequencing Depth
Sequencing Depth: Finding the Right Balance
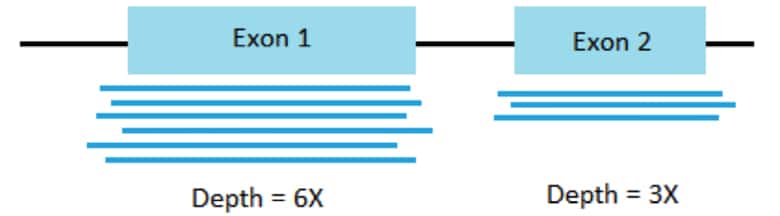
- What it is: The average number of times each base in the genome (or transcriptome) is sequenced.
- Why it matters:
- Sensitivity: Higher depth increases the chance of detecting rare transcripts or variants.
- Accuracy: Higher depth improves the accuracy of gene expression quantification and variant calling.
- Factors to consider:
- Research goals: Higher depth is needed for detecting rare events or subtle changes.
- Genome size and complexity: Larger genomes require higher depth for adequate coverage.
- Budget: Higher depth increases sequencing costs.
- Typical ranges:
- RNA-Seq for gene expression: 10-30 million reads per sample
- RNA-Seq for isoform detection: 30-60 million reads per sample
- Variant calling: 30-50x coverage for whole-genome sequencing
Transcriptome Coverage
Transcriptome Coverage: Capturing the Full Picture
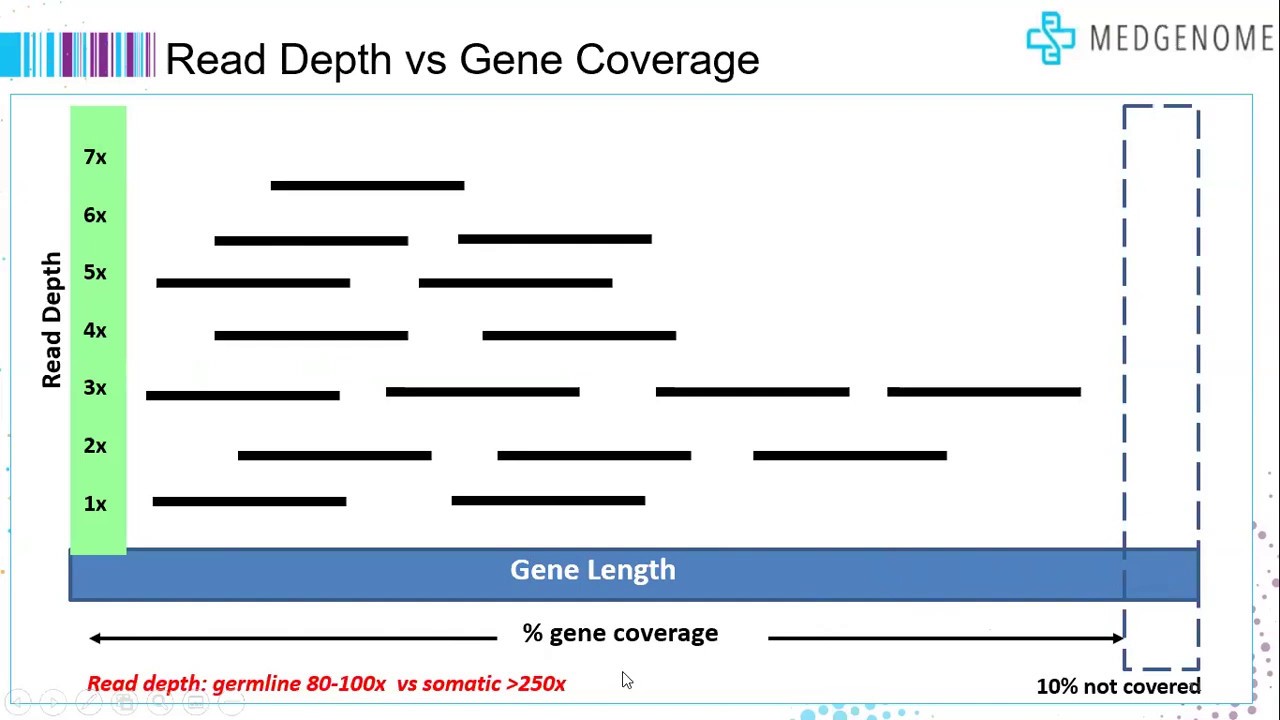
- What it is: The extent to which the sequencing reads represent the entire transcriptome.
- Why it matters:
- Completeness: High coverage ensures that all expressed transcripts are captured, including rare and low-abundance transcripts.
- Accuracy: Adequate coverage is needed for accurate quantification of gene expression levels.
- Discovery: High coverage increases the chances of identifying novel transcripts and isoforms.
- Factors influencing coverage:
- Sequencing depth: Higher depth generally leads to better coverage.
- Library complexity: A diverse library with a wide range of fragment sizes improves coverage.
- RNA integrity: High-quality RNA ensures that all transcripts are represented in the library.
- Sequencing technology: Different platforms have different read lengths and biases, which can affect coverage.
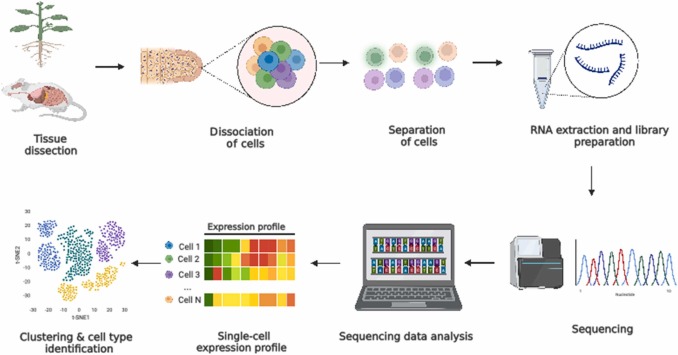
Single-Cell RNA Sequencing
Zooming In: Analyze gene expression in individual cells
Spatial Transcriptomics
Spatial Transcriptomics: mapping gene expression in context
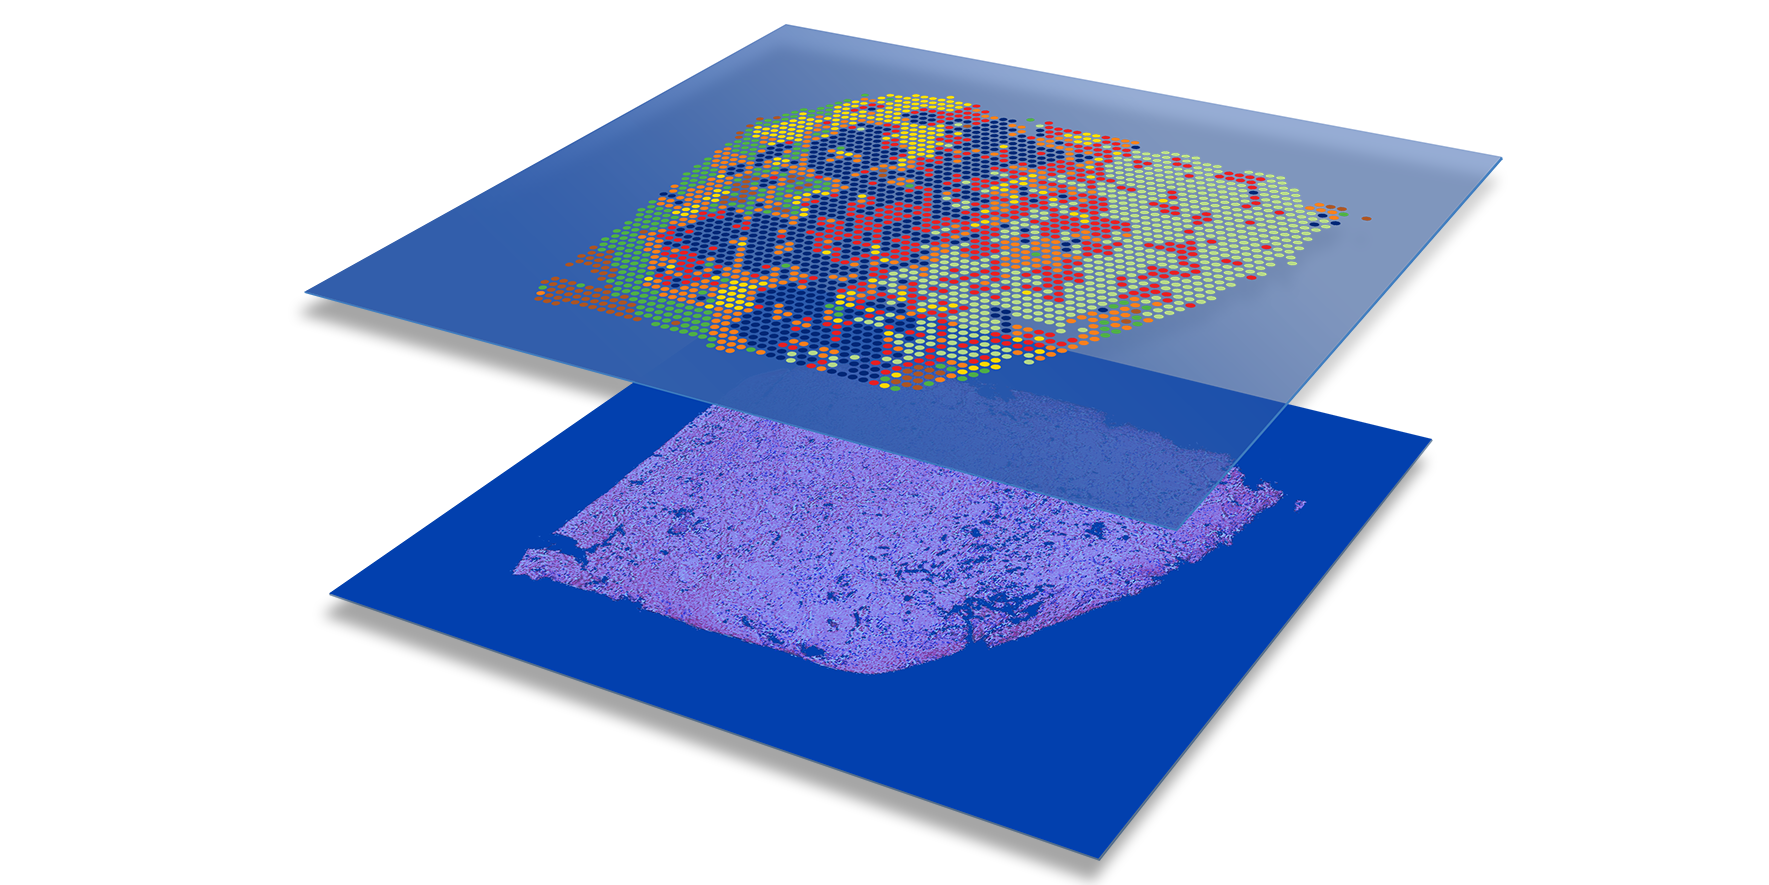
- Bridges histology and genomics: Combines traditional tissue imaging with high-throughput RNA sequencing.
- Preserves spatial context: Maps gene expression while retaining spatial information, unlike traditional scRNA-seq.
- Enables:
- Visualization of gene expression patterns within tissues.
- Quantitative analysis of transcriptomes in a spatial context.
- Applications:
- Understanding tissue organization and cellular interactions.
- Investigating developmental processes (organogenesis).
- Studying disease progression and heterogeneity.
Spatial Transcriptomics
Spatial Transcriptomics: from technology to discovery
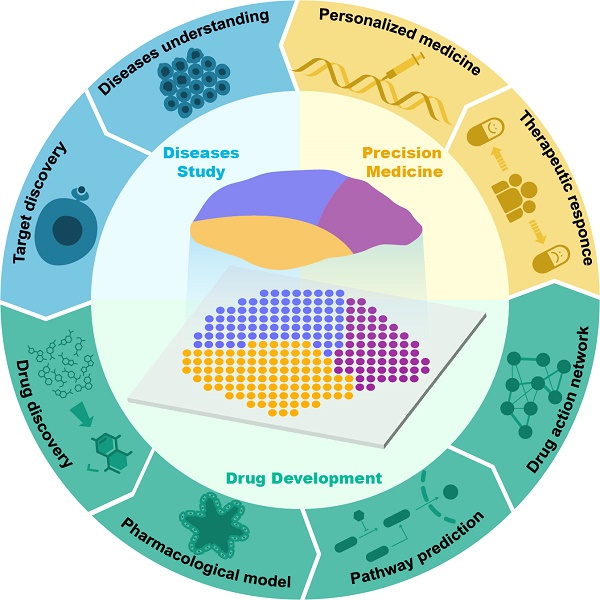
- Applications:
- Tissue heterogeneity: Studying complex tissues like the cochlea. (Tisi, 2023)
- Disease mechanisms: Uncovering cellular dynamics in diseases like Alzheimer’s. (Chen et al., 2020)
- Data analysis:
- Dimension reduction, deconvolution, and integration with histological images.
- Specialized tools for cell type deconvolution. (Cable et al., 2021)
Integration of RNA-Seq with other omics data
Unlocking biological insights through data integration
- Applications:
- Identifying key pathways: Integration of RNA-seq and metabolomics reveals regulated pathways in liver metabolism. (Zhang et al., 2020)
- Disease biomarkers: Uncovering disease-specific biomarkers in NAFLD using RNA-seq and metabolomics. (Ji et al., 2022)
- Tools and Techniques:
- Machine learning: rSeqTU for predicting transcription units and integrating with metagenomics and metabolomics. (Hou et al., 2022)
- Statistical analysis: DESeq2 for integrating RNA-seq and ChIP-seq data. (Niu et al., 2019)
- Single-cell multi-omics: Combining scRNA-seq with lipidomics and metabolomics to study cellular heterogeneity. (Cao et al., 2020)